


The Powerful Geological Story Told by Raised Relief Maps
Unveiling Earth's Secrets Through Tangible Terrain
Maps have always been fundamental tools for understanding our world, translating complex geographical data into visual representations. While flat, two-dimensional maps excel at showing location, boundaries, and basic routes, they often fall short in conveying the nuances of Earth's surface relief—its hills, valleys, mountains, and plains.
For anyone seeking a deeper comprehension of geological forces and landform development, this lack of tangible dimension on a flat map can be a significant limitation. It's challenging to truly grasp the steepness of a mountain range, the depth of a canyon, or the subtle undulations of a river valley without experiencing them in three dimensions.
This is where raised relief maps offer a powerful and intuitive solution. By physically representing elevation changes, these maps provide unparalleled geological insights, allowing users to literally feel and see the shape of the land in a way that 2D maps simply cannot replicate. This post will explore the specific geological understanding that raised relief maps unlock, from basic topography to complex structural geology and the dynamics of Earth's ever-changing surface.
What Exactly Are Raised Relief Maps?
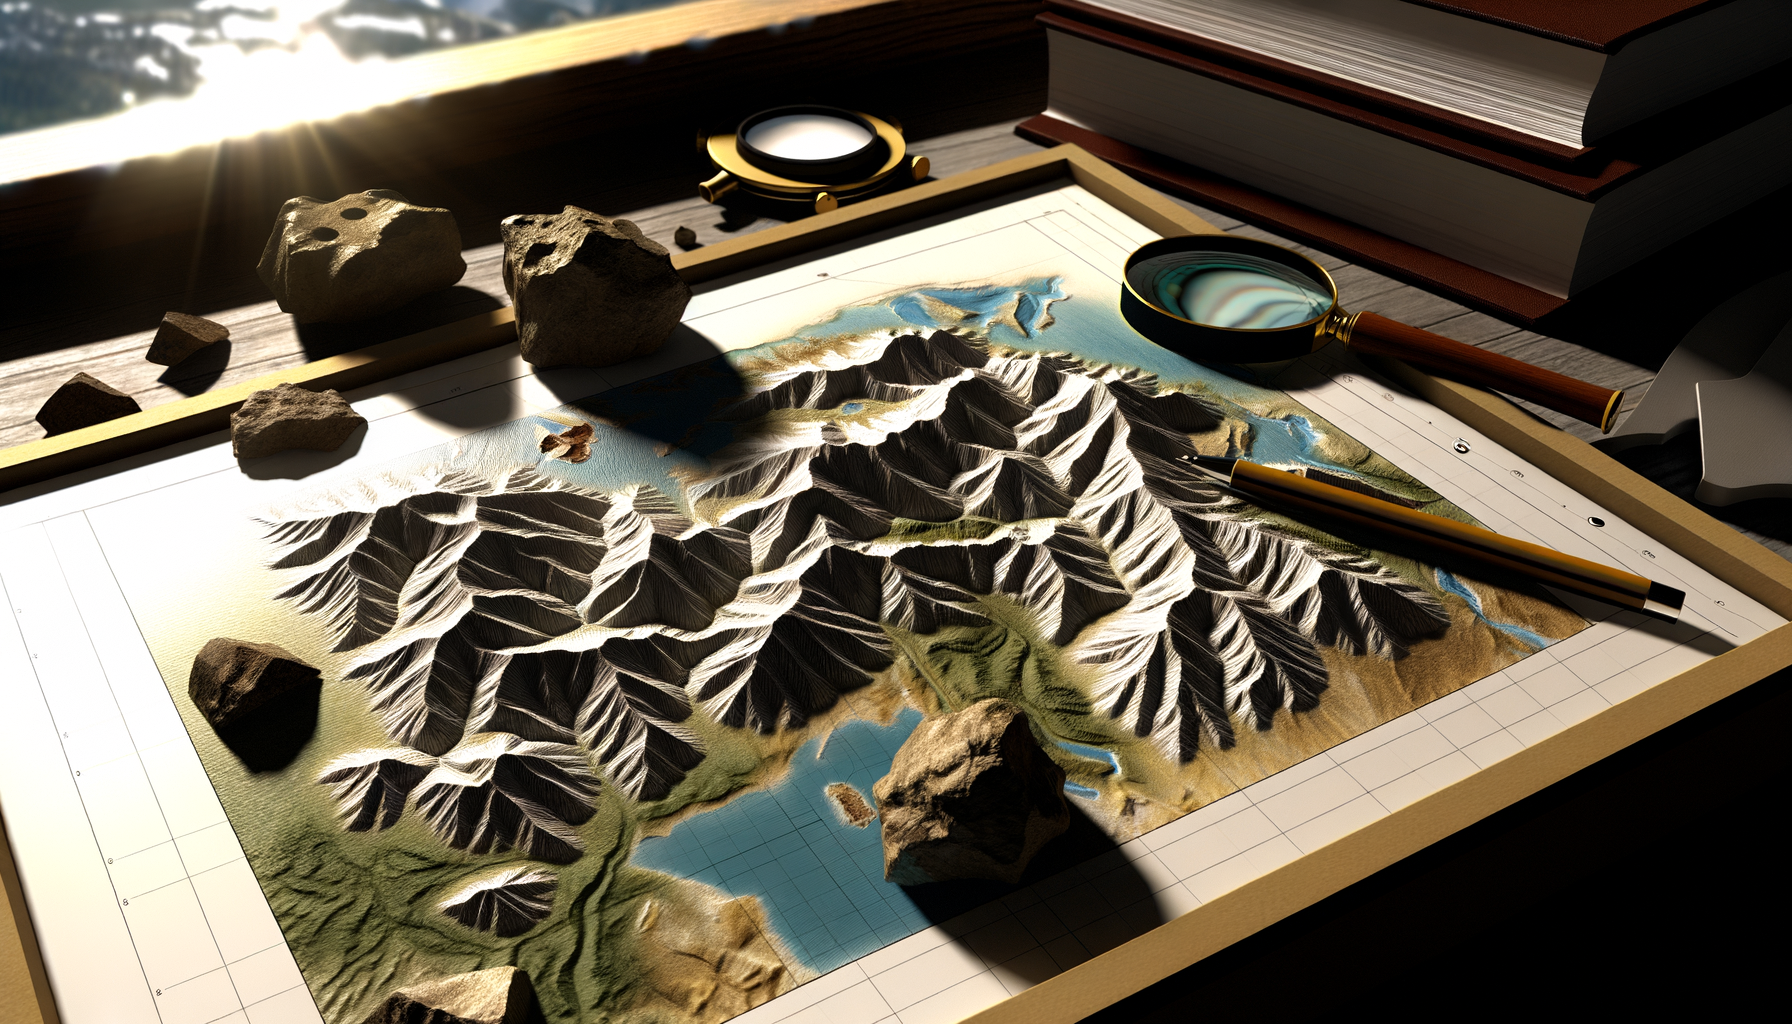
At their core, raised relief maps are topographic maps that have been manufactured to display elevation data using a three-dimensional form. Unlike standard flat maps where elevation is indicated solely by contour lines, shading, or color gradients, raised relief maps literally pop off the surface, giving physical shape to the landscape.
These maps are typically created using processes like vacuum forming plastic sheets over a mold that represents the terrain, or by printing on specialized materials that can then be embossed or molded. The resulting map is a tactile representation where mountains rise, valleys sink, and plains stretch out in physical form.
A key characteristic of many raised relief maps is the exaggeration of vertical scale compared to the horizontal scale. This exaggeration is often necessary to make subtle elevation changes, like gentle hills or plateaus, visually and physically apparent. Without this vertical boost, much of the world's terrain, especially less dramatic landscapes, would appear nearly flat on a physically realistic scale map.
Why Raised Relief Maps Are Indispensable for Geological Study
Geology is fundamentally about understanding Earth's physical structure, its history, and the processes that shape it. Many of these processes, such as erosion, tectonic uplift, and volcanic activity, leave their distinct marks on the planet's surface, shaping the very landforms we see today.
While geological maps show the distribution of rock types, faults, and folds beneath the surface, they are often interpreted alongside topographic maps which show the surface expression of these underlying features and processes. A flat topographic map requires the user to interpret contour lines and shading to mentally construct a 3D image of the terrain, a skill that takes practice and experience.
Raised relief maps bypass this mental reconstruction by providing an immediate, intuitive, three-dimensional model of the terrain. This tangible representation allows for a much quicker and deeper spatial understanding of the relationship between geological features and their surface manifestation, making complex concepts more accessible and easier to study.
Delving into Specific Geological Insights Provided by Raised Relief Maps
The power of raised relief maps for geological insight lies in their ability to make the intricate relationship between underlying geology and surface topography immediately apparent. They transform abstract concepts into tangible realities, offering perspectives often missed on flat maps.
Let's explore some of the key geological areas where these 3D maps provide invaluable understanding and insight.
Topography and Landform Interpretation
Understanding topography—the arrangement of the natural and artificial physical features of an area—is the bedrock of many geological studies. Raised relief maps excel at displaying this foundational information in a way that is instantly understandable.
You can see and feel the gradient of slopes, the relative heights of mountains, the depths of valleys, and the flatness of plains. The three-dimensional form allows for intuitive comparisons of different landforms within a region, making it easy to identify mountain ranges, isolated peaks, expansive plateaus, or rolling hills.
The shape of individual landforms also speaks volumes about their geological history and the processes that formed them. A sharp, jagged peak suggests recent uplift and erosion, while a rounded, eroded hill indicates a longer history of weathering and wearing down.
Comparing the topography of different areas on a raised relief map can highlight variations in geological resistance to erosion. Harder, more resistant rocks often form ridges, peaks, and plateaus, while softer rocks are typically found in valleys and low-lying areas, patterns that are strikingly clear in 3D.
Understanding Drainage Patterns and Hydrology
Water flow is inextricably linked to topography; rivers, streams, and groundwater paths are dictated by the shape of the land. Raised relief maps provide exceptional insight into drainage patterns and watershed dynamics.
You can visually trace river networks from their headwaters in higher elevations down through valleys to larger rivers or lakes. The map makes the concept of a watershed—the area of land where all precipitation drains to a common outlet—intuitively clear by showing the surrounding ridges and hills that form the drainage divide.
Different geological structures and rock types can influence how rivers flow and the patterns they create. Raised relief maps help visualize classic drainage patterns like dendritic (tree-like, common in uniform rock), trellis (grid-like, common in folded terrain), radial (flowing away from a central point like a volcano), or rectangular (following fracture patterns).
Seeing the landscape in 3D also clarifies how water erosion works. Steep slopes channel water quickly, leading to faster erosion and potentially deeper valleys, while flatter areas result in slower flow and sediment deposition, forming features like floodplains, all of which are visible and understandable on a relief map.
Visualizing Geological Structures
Perhaps one of the most powerful applications of raised relief maps in geology is their ability to help visualize the surface expression of underlying geological structures. Features like faults, folds, domes, and basins often have a direct impact on topography.
Faults, which are fractures in the Earth's crust where there has been movement, can create scarps (steep cliffs or slopes). On a raised relief map, these fault scarps are clearly visible as abrupt changes in elevation or linear features cutting across the landscape.
Folds, where layers of rock have been bent, often correspond to specific topographic features. Anticlines (upward folds) can form elongated ridges or mountains, while synclines (downward folds) frequently create valleys or basins. Seeing the undulating surface on a relief map provides a powerful visual analogue to the folded rock layers beneath.
Larger structures like geological domes (upward bulges) and basins (downward depressions) are also immediately apparent as broad, elevated or depressed areas, respectively, often influencing regional drainage patterns and erosion which are also clearly visible on the map. Volcanic features like cones, craters, and calderas are also striking topographic expressions of geological structure and process, easily identified on a relief map.
Insights into Erosional and Weathering Processes
The Earth's surface is constantly being shaped by the forces of erosion and weathering. These processes wear down rocks and transport material, creating distinctive landforms over geological time.
Raised relief maps provide a visual record of these processes at work. You can see the sharp, angular forms created by glacial erosion in mountainous regions, such as cirques (bowl-shaped depressions), arêtes (sharp ridges), and U-shaped valleys, features very different from the V-shaped valleys typically carved by rivers.
In arid or semi-arid regions, relief maps can showcase landforms shaped by wind erosion and differential weathering, like mesas and buttes, which are flat-topped hills or columns protected by a resistant caprock layer over softer, eroded material.
The tactile nature of the map helps users appreciate the scale of these erosional features and understand how factors like slope, rock type, and climate interact to sculpt the landscape. The visual evidence of erosion patterns reinforces the dynamic nature of the Earth's surface.
Tracing Geomorphological History
The landforms we see today are the result of a long history of geological events. Raised relief maps can serve as powerful tools for interpreting this geomorphological history.
By examining the sequence of landforms and their relationships on a relief map, geologists and students can infer past processes. For instance, the presence of glacial features in areas currently free of ice indicates a history of glaciation.
Visible fault scarps might suggest recent seismic activity or ongoing tectonic uplift. Terraces along river valleys can be evidence of past changes in base level or periods of uplift, representing former floodplains.
The relative positions and shapes of landforms allow for the interpretation of erosional sequences and the evolution of drainage systems over time. The map provides a static snapshot that encapsulates the results of dynamic processes operating over vast timescales.
Applications in Resource Exploration
Understanding the surface expression of geological structures is often critical in the search for natural resources like oil, gas, minerals, and water. Raised relief maps play a supporting role in this field.
Many oil and gas reservoirs are found in structural traps, such as anticlines. Identifying potential folded structures visible in the topography on a raised relief map can guide initial exploration efforts or inform the interpretation of subsurface geophysical data.
Mineral deposits are frequently associated with faults, folds, or specific types of igneous intrusions, all of which can influence local topography. Visualizing the spatial relationship between landforms and known or suspected geological structures on a relief map can aid in targeting exploration areas.
Similarly, understanding groundwater flow and potential aquifer locations is tied to subsurface geology and surface topography, aspects that are better grasped through the 3D visualization offered by these maps.
Assessing Geological Hazards
Many geological hazards are directly related to topography and geological structure. Raised relief maps are valuable tools for visualizing areas vulnerable to such events.
Steep slopes, clearly identifiable on a relief map, are prone to landslides and rockfalls. Areas with significant elevation differences and complex drainage patterns can be at higher risk for flash floods.
Mapping the proximity of infrastructure or populations to visible fault lines, volcanic centers, or areas with unstable slopes allows for better risk assessment and land-use planning. The immediacy of the 3D representation helps communicate these risks effectively to a wider audience beyond geological experts.
Who Benefits from These Insights?
The geological insights provided by raised relief maps are not limited to academic geologists studying Earth's history or structure. A wide range of individuals and professions find these maps incredibly useful.
Educators: They are invaluable teaching tools, making abstract geological concepts like landform development, watershed dynamics, and structural geology tangible and easier for students to grasp at all levels.
Students: Learning geology, geography, or environmental science is greatly enhanced by being able to physically interact with a representation of the terrain, fostering a deeper intuitive understanding.
Urban Planners and Engineers: Understanding topography is crucial for site selection, infrastructure development, and managing risks like erosion, flooding, and landslides.
Environmental Scientists and Hydrologists: Analyzing drainage patterns, watershed boundaries, and terrain slope is fundamental to studying ecosystems, water resources, and pollutant transport.
Recreationists: Hikers, climbers, and outdoor enthusiasts use raised relief maps to understand terrain difficulty, plan routes, and appreciate the landscape they are exploring.
The Public: Anyone with curiosity about the natural world can gain a profound appreciation for the forces that shaped their local or regional landscape by interacting with a raised relief map.
Limitations and Complementary Tools
While incredibly powerful for visualizing terrain and its geological implications, raised relief maps do have limitations. They typically cannot show detailed subsurface geology, rock types (unless color-coded based on a separate geological map), or the precise location of many features shown on a purely geological map.
The vertical exaggeration, while useful for visualization, means the slopes are not depicted at their true angle relative to the horizontal. This is a necessary distortion for clarity but must be understood by the user.
Therefore, raised relief maps are best used in conjunction with other geological tools, such as flat geological maps showing rock units and faults, cross-sections illustrating subsurface structure, remote sensing data like aerial photographs or satellite imagery, and crucially, field observation.
Modern Digital Elevation Models (DEMs) and 3D geographic information systems (GIS) offer digital alternatives for visualizing topography, but the tactile experience and immediate intuition provided by a physical raised relief map remain unique and highly beneficial for learning and understanding.
Conclusion: A Tangible View of Earth's Geological Story
Raised relief maps offer a uniquely powerful perspective on Earth's geology. By translating abstract elevation data into a physical form, they make the complex relationship between landforms, geological structures, and the processes that shaped them tangible and immediately understandable.
From deciphering intricate drainage networks and identifying the surface traces of faults and folds to visualizing the cumulative effects of erosion over geological timescales, these maps provide insights that are difficult to obtain from their flat counterparts alone. They serve as invaluable tools for education, research, planning, and simple appreciation of the planet's dynamic surface.
In a world increasingly reliant on digital screens, the simple, tactile nature of a raised relief map offers a profound and intuitive way to connect with the powerful geological story written across the landscape, inviting users to explore and understand the ground beneath their feet in a truly hands-on way.