


Mapping Mountains: How Relief Maps Bring Terrain to Life
Imagine holding a standard map of a mountainous region. You see the roads, the rivers, maybe some labels for peaks. But how high are those mountains really? How steep are the slopes you might need to climb? Where will water drain after a rainstorm?
Standard two-dimensional maps, while excellent for showing horizontal distance and features, often fall short when it comes to communicating the vertical dimension of the landscape. This lack of elevation information can make navigating challenging terrain difficult, planning construction projects risky, and truly understanding the lay of the land nearly impossible. The undulating, complex nature of our planet's surface is flattened into a series of lines and symbols, losing its most dramatic characteristics.
Fortunately, mapmakers have developed ingenious methods over centuries to bring this missing dimension to life. These methods are encapsulated in what we call relief maps, or topographic maps that specifically emphasize elevation and terrain shape. Relief maps provide a visual and technical language for understanding hills, valleys, mountains, and plateaus, transforming a flat sheet into a window onto the three-dimensional world. They offer a solution to the challenge of visualizing terrain on a 2D surface, providing the critical information needed for everything from safe navigation in the wilderness to effective urban planning.
In this comprehensive guide, we will delve deep into the world of relief maps. We will explore what they are, the various techniques cartographers use to represent terrain, how modern technology has revolutionized their creation, and crucially, how to read and interpret them effectively. Whether you are a hiker planning your next trek, an urban planner assessing a site, a geologist studying landforms, or simply someone fascinated by the shape of the Earth, understanding relief maps is an invaluable skill. Join us as we uncover how these remarkable maps bring terrain to life, making the invisible visible and helping us navigate and understand the world around us with greater confidence and insight.
The Challenge of Visualizing a 3D World on a 2D Surface
Maps have been essential tools for humanity for millennia, helping us understand our place in the world and navigate from one point to another. From ancient Babylonian clay tablets to the digital maps in our pockets today, the fundamental purpose remains the same: to represent a portion of the Earth's surface. However, the Earth is not flat; it is a sphere covered in varied topography, a complex tapestry of rises and falls, peaks and valleys.
Representing this three-dimensionality accurately and intuitively on a flat piece of paper or a screen has always been one of cartography's greatest challenges. While symbols can indicate features like rivers, forests, or buildings, conveying the sense of vertical scale – how high a mountain is, how steep a slope is, or how a valley curves – requires specialized techniques. Without these techniques, a map can provide location, but it fails to capture the character and challenges of the terrain itself.
Understanding the terrain is not just an academic exercise; it has practical implications for countless human activities. The shape of the land dictates where water flows, how easily infrastructure can be built, where certain plants or animals can thrive, and how physically demanding it is to traverse. A map that ignores or inadequately represents relief misses a critical piece of information that can influence safety, efficiency, and understanding. This is where relief maps step in, offering a crucial layer of data that bridges the gap between a flat representation and the dynamic, undulating reality of the Earth's surface. They provide the necessary tools to move beyond simple location tracking and truly engage with the landscape in its full, three-dimensional complexity.
What Exactly Are Relief Maps?
At its core, a relief map is any map designed to show the shape and elevation of the land. The term "relief" in geography refers to the variation in elevation and slope across a specific area of the Earth's surface. It describes the differences in height between the highest and lowest points, as well as the form and steepness of the intervening slopes.
Therefore, a relief map focuses on depicting this vertical dimension, making it distinct from planimetric maps that only show horizontal features. While many different techniques exist to represent relief, the common goal is to give the map user a clear understanding of the topography. These maps are sometimes referred to more broadly as topographic maps, especially when they include other cultural and natural features in addition to elevation data.
The purpose of emphasizing relief is to allow the map reader to visualize the three-dimensional landscape from a two-dimensional perspective. This allows for a much richer understanding of the geography than a map without elevation information could provide. Whether through lines, colors, shading, or physical models, relief maps translate complex vertical data into a format that humans can interpret, helping us "see" the hills and valleys even though the map itself is flat. They are fundamental tools for anyone whose activities or studies involve interacting with or analyzing the physical landscape.
Key Techniques for Representing Relief
Cartographers have developed a variety of ingenious methods to represent the three-dimensional nature of terrain on a two-dimensional map. Each technique has its strengths and weaknesses, and often multiple methods are combined on a single map to enhance clarity and readability. Understanding these techniques is key to effectively using and interpreting relief maps. These methods range from ancient drawing techniques to modern digital renderings, reflecting centuries of innovation in cartography.
Contour Lines: The Invisible Elevation Lines
Perhaps the most common and technically precise method for representing relief on modern topographic maps is the use of contour lines. A contour line is an imaginary line drawn on a map that connects points of equal elevation above a specified reference point, usually sea level. Think of it as slicing through the landscape with horizontal planes at regular vertical intervals and then drawing the outlines of those slices on your map.
The pattern and spacing of these lines provide crucial information about the terrain. Where contour lines are close together, the slope is steep; the elevation changes rapidly over a short horizontal distance. Conversely, where contour lines are far apart, the slope is gentle, indicating a gradual change in elevation. The shape of the contour lines also reveals the shape of the landforms; V-shapes pointing uphill usually indicate valleys or stream beds, while V-shapes pointing downhill often represent ridges.
Contour lines are typically drawn at a regular vertical interval, known as the contour interval. This interval is constant for a given map sheet, although it may vary between different maps depending on the scale and the ruggedness of the terrain being depicted. For example, a map of a flat area might have a 10-foot contour interval, while a map of a mountainous region might use a 50-foot or 100-foot interval to avoid the map being overwhelmed by too many lines. Every fifth or tenth contour line is usually drawn thicker and labeled with its elevation; these are called index contours, and they help users quickly determine elevations.
Intermediate contours are the thinner lines drawn between index contours, representing the elevations at the standard contour interval. Supplementary contours, often dashed, may be used in very flat areas to show subtle changes in elevation at a smaller interval than the main contours. Understanding contour lines requires a bit of practice, but once mastered, they offer a powerful and quantitative way to read the landscape, allowing users to determine elevations, calculate slope, identify landforms, and plan routes with precision. They provide the foundational structure upon which other relief representation methods often build.
Shading and Hillshading
While contour lines provide precise quantitative data, they can sometimes be difficult to visualize as a three-dimensional surface, especially for novice map readers. Shading, particularly hillshading, is a technique that uses light and shadow to create a more intuitive, pictorial representation of the relief. This method simulates the appearance of the terrain under oblique illumination, making hills look like hills and valleys look like valleys.
Hillshading works by assuming a light source, typically from the northwest or sometimes the northwest-north, shining down on the terrain. Areas facing the light source are depicted in lighter tones, while areas facing away are shown in darker tones or shadows. This creates a sense of depth and form, mimicking how we perceive relief in the real world under natural lighting conditions. Steeper slopes facing away from the light source will appear darker than gentler slopes or flat areas.
Shading can be applied on its own, but it is most effective when used in conjunction with contour lines. The shading helps the reader quickly grasp the overall shape and feel of the landscape, while the contour lines provide the specific elevation values and allow for more precise analysis of slope and height. Modern digital mapping techniques make generating sophisticated hillshading relatively easy from digital elevation models, allowing for nuanced and realistic terrain visualization. The combination of shading and contours offers the best of both worlds: intuitive visualization and precise data.
Hachures: An Older, Illustrative Technique
Hachures represent a more historical method of showing relief, particularly popular before the widespread adoption of contour lines. This technique uses short lines drawn in the direction of the steepest slope. The thickness and density of the hachures indicate the steepness of the slope; thicker and more numerous lines suggest steeper terrain, while thinner and sparser lines indicate gentler slopes.
Hachures provide a visual representation of slope direction and relative steepness, making the terrain look textured. However, they do not provide specific elevation values, unlike contour lines. This limits their usefulness for precise elevation determination or calculating exact slopes. While largely replaced by contour lines and shading on most modern maps requiring technical accuracy, hachures can still be found on some maps, particularly older ones or those where the primary goal is illustrative rather than quantitative. They offer an artistic and intuitive way to depict mountainous terrain, conveying a sense of ruggedness and form.
Hypsometric Tinting (Color Ramps)
Hypsometric tinting, also known as layer tinting or color ramps, uses different colors to represent different ranges of elevation. A key is provided on the map to show which color corresponds to which elevation band. For example, green might be used for lower elevations, yellow and orange for mid-elevations, and brown and white for higher elevations.
This technique provides a quick visual overview of the general elevation patterns across the map area. It allows users to instantly identify high and low areas and see the approximate elevation of any point based on its color. While hypsometric tinting is excellent for showing broad elevation zones, it does not show the precise shape of the landforms or the steepness of slopes as effectively as contour lines or shading.
Hypsometric tints are often used in conjunction with contour lines and shading to create a visually rich and informative relief map. The colors provide context for the elevation values indicated by the contours, and the shading adds a sense of texture and form. This combination is frequently seen on wall maps, atlases, and online mapping platforms, providing a clear and engaging representation of large areas with significant elevation variation. The choice of color scheme can influence how intuitively the elevation changes are perceived.
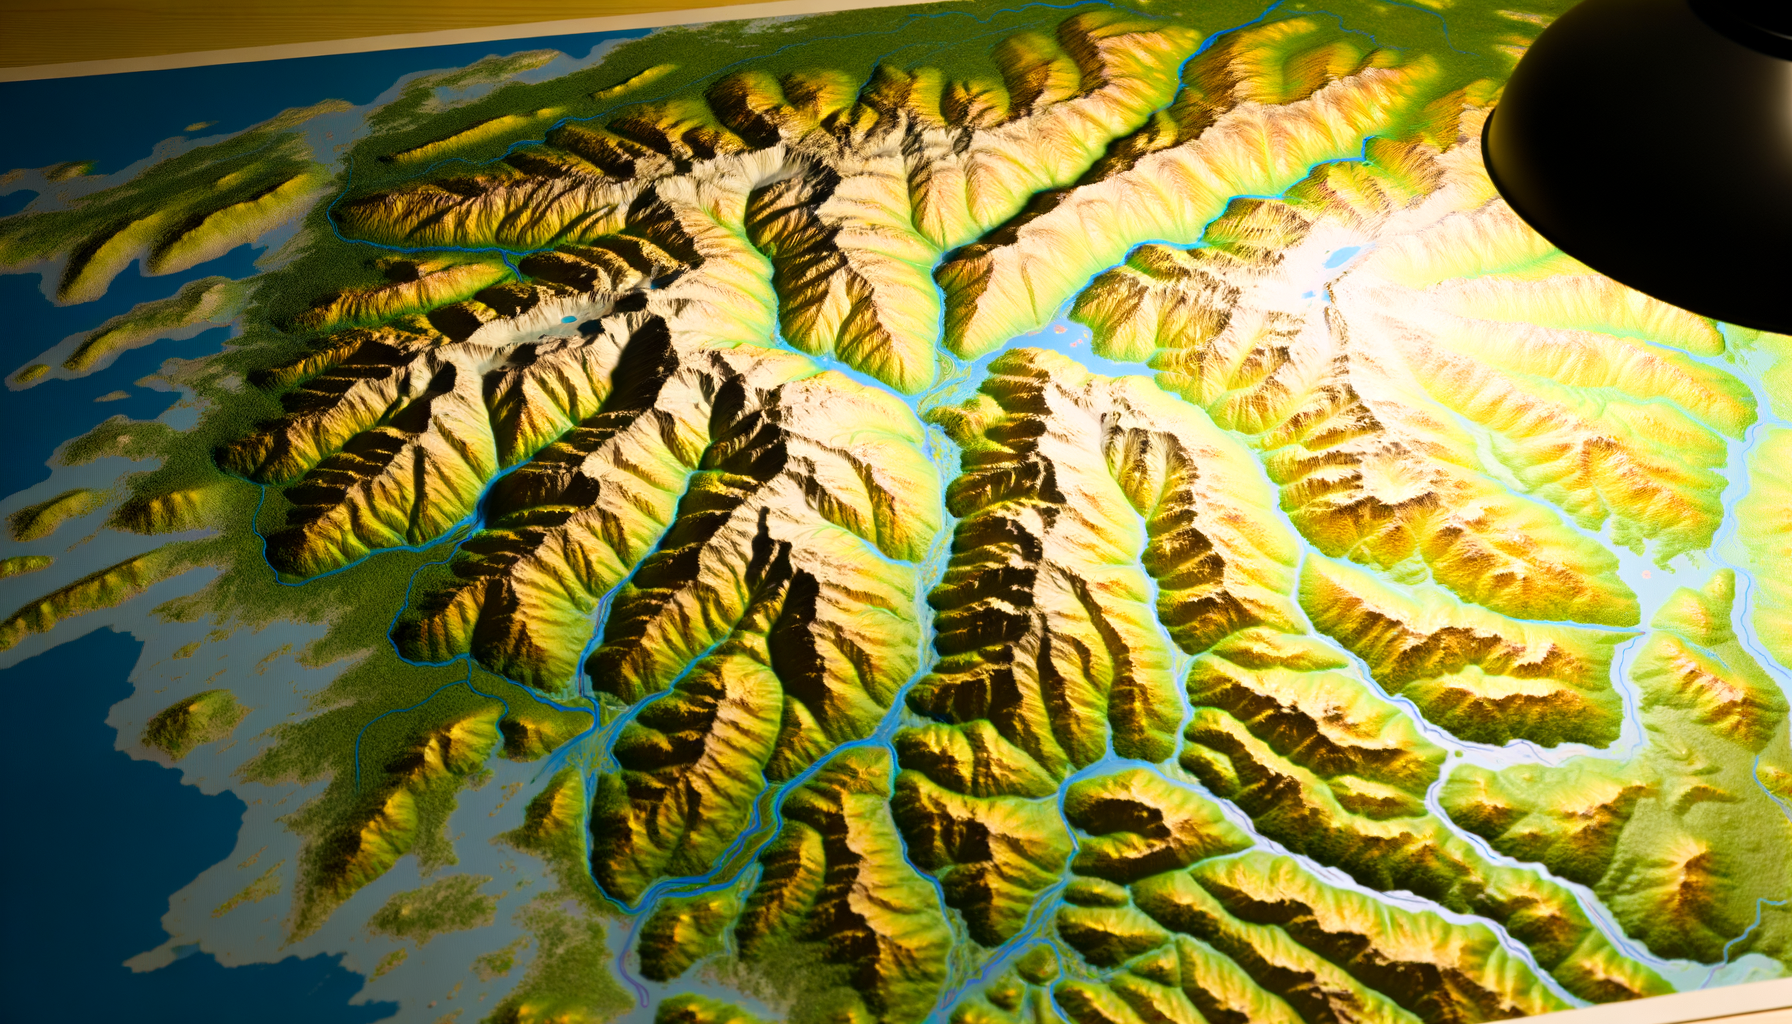
Physical Relief Models
Physical relief models are perhaps the most direct way to represent terrain: they are three-dimensional models built to scale, with the vertical dimension often exaggerated to emphasize features. These models allow users to see and even feel the shape of the land, providing a truly tactile experience of the topography. They are built using various materials, from plaster and foam to plastic and digital fabrication techniques.
While incredibly intuitive and easy to understand, physical models have practical limitations. They are bulky, expensive to produce, difficult to transport, and cannot contain the same level of detailed information (like specific street names or property lines) as a flat map. They are most commonly found in museums, visitor centers, educational institutions, or planning offices where space allows and the primary goal is to provide a clear, tangible understanding of the terrain's general form and scale. Despite their limitations for everyday navigation, they offer an unparalleled way to visualize and comprehend the Earth's topography in a truly three-dimensional format.
Modern Technologies Driving Relief Mapping
The advent of computers and advanced sensing technologies has revolutionized the creation and use of relief maps. What once required painstaking manual surveying and drafting can now be accomplished with incredible speed, accuracy, and detail using digital methods. Modern relief mapping relies heavily on the collection and processing of digital elevation data. These technologies not only make mapping easier but also enable new ways of analyzing and visualizing terrain that were previously impossible. They have transformed relief mapping from a specialized cartographic art into a powerful analytical tool integrated into numerous fields.
Digital Elevation Models (DEMs)
At the heart of modern digital relief mapping are Digital Elevation Models (DEMs). A DEM is a gridded representation of the Earth's surface, where each grid cell (or pixel) stores a single elevation value for that location. Imagine a giant checkerboard laid over the landscape, where each square on the board has a number indicating the average height of the ground within that square. The size of the grid cells determines the resolution of the DEM; smaller cells mean higher resolution and more detailed representation of the terrain.
DEMs can be created from various sources, including topographic maps, satellite imagery, aerial photography using stereoscopy, and radar interferometry. They are fundamental datasets used in Geographic Information Systems (GIS) for a wide range of analyses, not just map creation. The accuracy and resolution of DEMs vary depending on the source and technology used to create them, with higher resolution DEMs capable of capturing very subtle changes in elevation. These digital models are the foundation for creating many different types of terrain visualizations, from simple shaded relief to complex 3D models.
LiDAR: Laser Scanning the Landscape
Light Detection and Ranging (LiDAR) is one of the most powerful and accurate technologies for creating high-resolution DEMs. LiDAR systems mounted on aircraft or drones emit rapid pulses of laser light towards the ground. Sensors measure the time it takes for the light pulses to return after reflecting off the surface. By knowing the speed of light and the position of the aircraft, the distance to the ground can be precisely calculated.
Tens or hundreds of thousands of these measurements per second create a dense "point cloud" of elevation data points. Sophisticated processing software can then filter out points reflected from vegetation, buildings, and other objects to reveal the bare earth surface, resulting in an exceptionally detailed and accurate DEM. LiDAR data is revolutionizing terrain mapping, allowing for the identification of subtle landforms invisible to the naked eye or traditional methods, such as ancient earthworks, faint stream channels, or subtle geological features. Its ability to penetrate vegetation makes it invaluable for mapping heavily forested areas where traditional aerial photography struggles to capture the ground surface.
Geographic Information Systems (GIS)
Geographic Information Systems (GIS) are powerful software platforms used to store, manage, analyze, and visualize geographic data, including DEMs. GIS allows users to take raw elevation data and process it to create various useful terrain derivatives and visualizations. From a single DEM, a GIS can generate slope maps (showing the steepness of the terrain), aspect maps (showing the direction slopes are facing), viewshed maps (showing areas visible from a specific point), cross-sections, and three-dimensional surface models.
GIS enables sophisticated spatial analysis based on elevation, such as modeling water flow, identifying areas prone to landslides, determining optimal locations for communication towers, or analyzing wildlife habitat based on elevation and slope. It integrates elevation data with other geographic information layers (like roads, rivers, property boundaries, or population density) to provide comprehensive insights into the landscape and its interaction with human and natural systems. Modern relief maps are often the output of GIS analysis and visualization tools, making terrain information accessible and actionable for a wide range of applications.
Reading and Interpreting Relief Maps
Understanding how to read a relief map effectively unlocks its full potential as a tool for navigation, planning, and discovery. While the various techniques discussed above might seem complex, the principles are straightforward and become intuitive with practice. Reading a relief map involves more than just identifying features; it requires visualizing the three-dimensional landscape represented on the flat page. It's about seeing the contours merge into slopes, the colors blend into elevation zones, and the shading create hills and valleys.
Start by locating the map legend, which will explain the contour interval, the meaning of hypsometric colors (if used), and any other symbols related to terrain representation. Pay close attention to the index contours, the thicker lines with labeled elevations, as they provide quick reference points for estimating the height of surrounding areas. Trace a few contour lines to get a feel for how they define landforms; closed loops typically represent hills or depressions, while lines that run parallel to each other indicate a uniform slope.
Look at the spacing of the contour lines to gauge the steepness. Closely spaced contours mean steep terrain, which will be challenging to ascend or descend. Widely spaced contours indicate gentle slopes or flat ground, which will be much easier to traverse. If shading is used, observe how the light and shadow highlight the terrain features, reinforcing the shape suggested by the contours. Remember the assumed light source (often northwest) and interpret the light and dark areas accordingly; shaded slopes are generally facing away from the light and are often steeper than sunlit slopes facing towards it.
Practice visualizing cross-sections by drawing an imaginary line across a series of contours and mentally sketching the elevation profile along that line. This exercise helps translate the two-dimensional contour pattern into a three-dimensional mental image. Pay attention to how contour lines behave around streams and ridges. Lines crossing a stream will typically form a V-shape pointing uphill (upstream), while lines crossing a ridge will also form a V-shape, but pointing downhill. By combining the information from contours, shading, colors, and any other relief representation methods used on the map, you can build a comprehensive mental model of the landscape. This allows for informed decisions about route planning, understanding drainage patterns, or assessing the visibility of different areas.
Real-World Applications of Relief Maps
The ability to visualize and analyze terrain is crucial for a vast array of activities and professions. Relief maps are not just tools for geographers or cartographers; they are essential resources used daily in fields ranging from outdoor recreation to civil engineering and environmental management. Their capacity to communicate the physical reality of the land provides critical context for decision-making in diverse scenarios. From navigating a mountain trail to deciding where to build a new road or assess flood risk, relief maps offer indispensable insights.
Hiking, Backpacking, and Navigation
For anyone venturing into the wilderness, a topographic map with detailed relief information is arguably the most important tool after a compass or GPS device. Relief maps allow hikers and backpackers to plan routes based on elevation gain and loss, helping to estimate the difficulty and time required for a hike. By studying the contour lines, they can identify the easiest paths up a slope, predict where water sources might be found (often in valleys indicated by V-shaped contours pointing uphill), and recognize potential hazards like cliffs or steep drop-offs where contours are extremely close together.
In poor visibility conditions, such as fog or thick forest, relief maps combined with a compass or GPS are vital for navigation. Experienced navigators can use the shape of the land – identifying hills, valleys, ridges, and saddles depicted on the map – to orient themselves and confirm their location. Understanding the terrain prevents getting lost and ensures a safer and more enjoyable outdoor experience. It allows adventurers to choose routes that match their skill level and physical fitness, ensuring they are prepared for the challenges the landscape presents.
Urban Planning and Development
In urban and regional planning, understanding terrain is fundamental. Planners use relief maps and digital elevation data to assess potential building sites, considering factors like slope stability, drainage, and the cost of construction on varied topography. Steep slopes might be unsuitable for certain types of development, while low-lying areas might be prone to flooding, requiring special consideration for infrastructure and building design.
Relief data is also critical for planning infrastructure like roads, railways, and pipelines, where minimizing steep grades and avoiding difficult terrain is essential for efficiency and safety. Furthermore, planners use viewshed analysis derived from DEMs to understand what can be seen from different locations, which is important for zoning regulations, preserving scenic views, and siting buildings appropriately. Effective urban planning requires integrating human needs with the physical constraints and opportunities presented by the landscape, and relief maps provide the necessary data for this integration. They help shape sustainable and resilient communities by informing decisions about land use, infrastructure placement, and environmental protection.
Environmental Science and Resource Management
Environmental scientists, hydrologists, foresters, and land managers rely heavily on relief maps and terrain analysis. Elevation data is fundamental for modeling water flow and drainage patterns, which is essential for managing water resources, predicting flood risk, and controlling erosion. Understanding the slope and aspect (direction a slope faces) of the terrain helps in analyzing vegetation distribution, wildlife habitat suitability, and soil properties, as these are often influenced by elevation and topography.
Relief maps are used in forestry for planning logging operations and managing forest health, considering how terrain affects access and the spread of wildfires. In conservation, they help identify sensitive areas, plan restoration projects, and manage land use to protect natural resources. Analyzing terrain is also crucial for assessing geological hazards like landslides and rockfalls, allowing for better mitigation and planning in vulnerable areas. Environmental monitoring and resource management benefit immensely from the spatial insights provided by detailed terrain information.
Geology and Earth Science
Geologists use relief maps to study landforms, understand the underlying geological structures, and analyze the processes that have shaped the Earth's surface over time. Topography is a direct expression of geology; different rock types and geological structures erode at different rates and in different patterns, creating distinctive landforms visible on relief maps. Features like fault lines, anticlines, synclines, and volcanic cones often have characteristic topographic signatures.
Relief maps help geologists identify and map geological units, analyze drainage networks (which are often controlled by geological structure), and assess seismic hazards. Studying changes in elevation and slope can reveal active fault zones or areas prone to subsidence or uplift. Modern high-resolution DEMs derived from LiDAR are particularly valuable for geological mapping, revealing subtle features previously undetectable through traditional field methods. Understanding the relief is fundamental to understanding the Earth's geological past and present.
Education and Recreation
Beyond professional uses, relief maps are powerful educational tools, helping students understand geographical concepts like elevation, landforms, and watersheds. They provide a tangible way to visualize abstract ideas about the Earth's surface. For recreationalists beyond hiking, such as skiers, climbers, mountain bikers, or even landscape photographers, relief maps are essential for route planning, assessing difficulty, and identifying areas of interest. They allow enthusiasts to engage with the landscape in a more informed and strategic way.
Understanding topography can enhance appreciation for the natural world and the forces that shape it. It turns a simple walk or drive into an opportunity to interpret the landscape, recognizing how streams have carved valleys, how glaciers have sculpted mountains, or how tectonic forces have uplifted entire ranges. Relief maps make geography come alive, connecting the lines and colors on the page to the physical world we inhabit.
Choosing and Using the Right Relief Map
Given the variety of relief maps and the techniques used to create them, choosing the right map for your specific needs is important. Consider the purpose of your map usage and the area you will be covering. For detailed navigation in a small area, a large-scale map with a small contour interval and clear contour lines combined with shading is usually best. For planning a road trip across a large region, a smaller-scale map with hypsometric tinting might be sufficient to give you a general overview of the elevation changes.
Consider whether a physical paper map or a digital map on a device is more suitable. Paper maps do not run out of battery and can be easily marked, but they are bulky and static. Digital maps are interactive, can be updated, and often integrate with GPS, but they rely on technology that can fail. Many outdoor enthusiasts carry both a paper map and a digital option as a backup. Ensure the map is current, as terrain can change due to natural events or human activity, although major topographical features generally remain stable over shorter time scales.
When using a relief map for navigation, always orient your map to align with the real-world landscape. This can be done using a compass or by identifying known features on the map and matching them to features you can see in the terrain around you. Learn to estimate distances and elevations accurately from the map and combine the information from the map with your observations of the actual terrain. Practice interpreting the nuances of contour lines and shading in different types of landscapes.
Integrating digital relief maps with GPS devices or smartphone apps provides powerful navigation capabilities, showing your real-time location overlaid on the terrain. However, understanding how to read the underlying relief map data is still crucial, especially if the technology fails. Consider the source and accuracy of the digital data if using online maps or apps; data derived from high-resolution sources like LiDAR will be significantly more detailed than that from older or lower-resolution sources. Ultimately, proficiency in using relief maps comes with practice and a willingness to translate the two-dimensional representation into a three-dimensional understanding of the world.
Conclusion: Bringing the Landscape to Life
Relief maps are remarkable achievements in cartography, solving the age-old problem of depicting the Earth's complex, three-dimensional surface on a flat medium. Through techniques like contour lines, shading, hypsometric tinting, and modern digital elevation models, they transform abstract elevation data into visual representations that allow us to understand the shape, slope, and scale of the land. From the peaks of the tallest mountains to the subtle undulations of a rolling plain, relief maps make the invisible visible, bringing the landscape to life before our eyes.
These maps are far more than just geographical curiosities; they are essential tools for a vast array of practical applications. They are indispensable for navigating the wilderness safely, planning sustainable development in urban areas, managing natural resources effectively, studying the geological processes that shape our planet, and educating ourselves and others about the world around us. The insights they provide are critical for making informed decisions that impact safety, efficiency, and our relationship with the environment.
Whether you are embarking on an adventure, planning a project, conducting scientific research, or simply seeking a deeper connection with the natural world, taking the time to understand and utilize relief maps will undoubtedly enhance your experience and capabilities. They offer a powerful lens through which to view and interact with the Earth's surface, revealing the hidden dimensions that define our physical environment. Embrace the challenge of interpreting these fascinating maps, and you will find that they unlock a richer, more dynamic understanding of the world, truly bringing the terrain to life beneath your fingertips.