


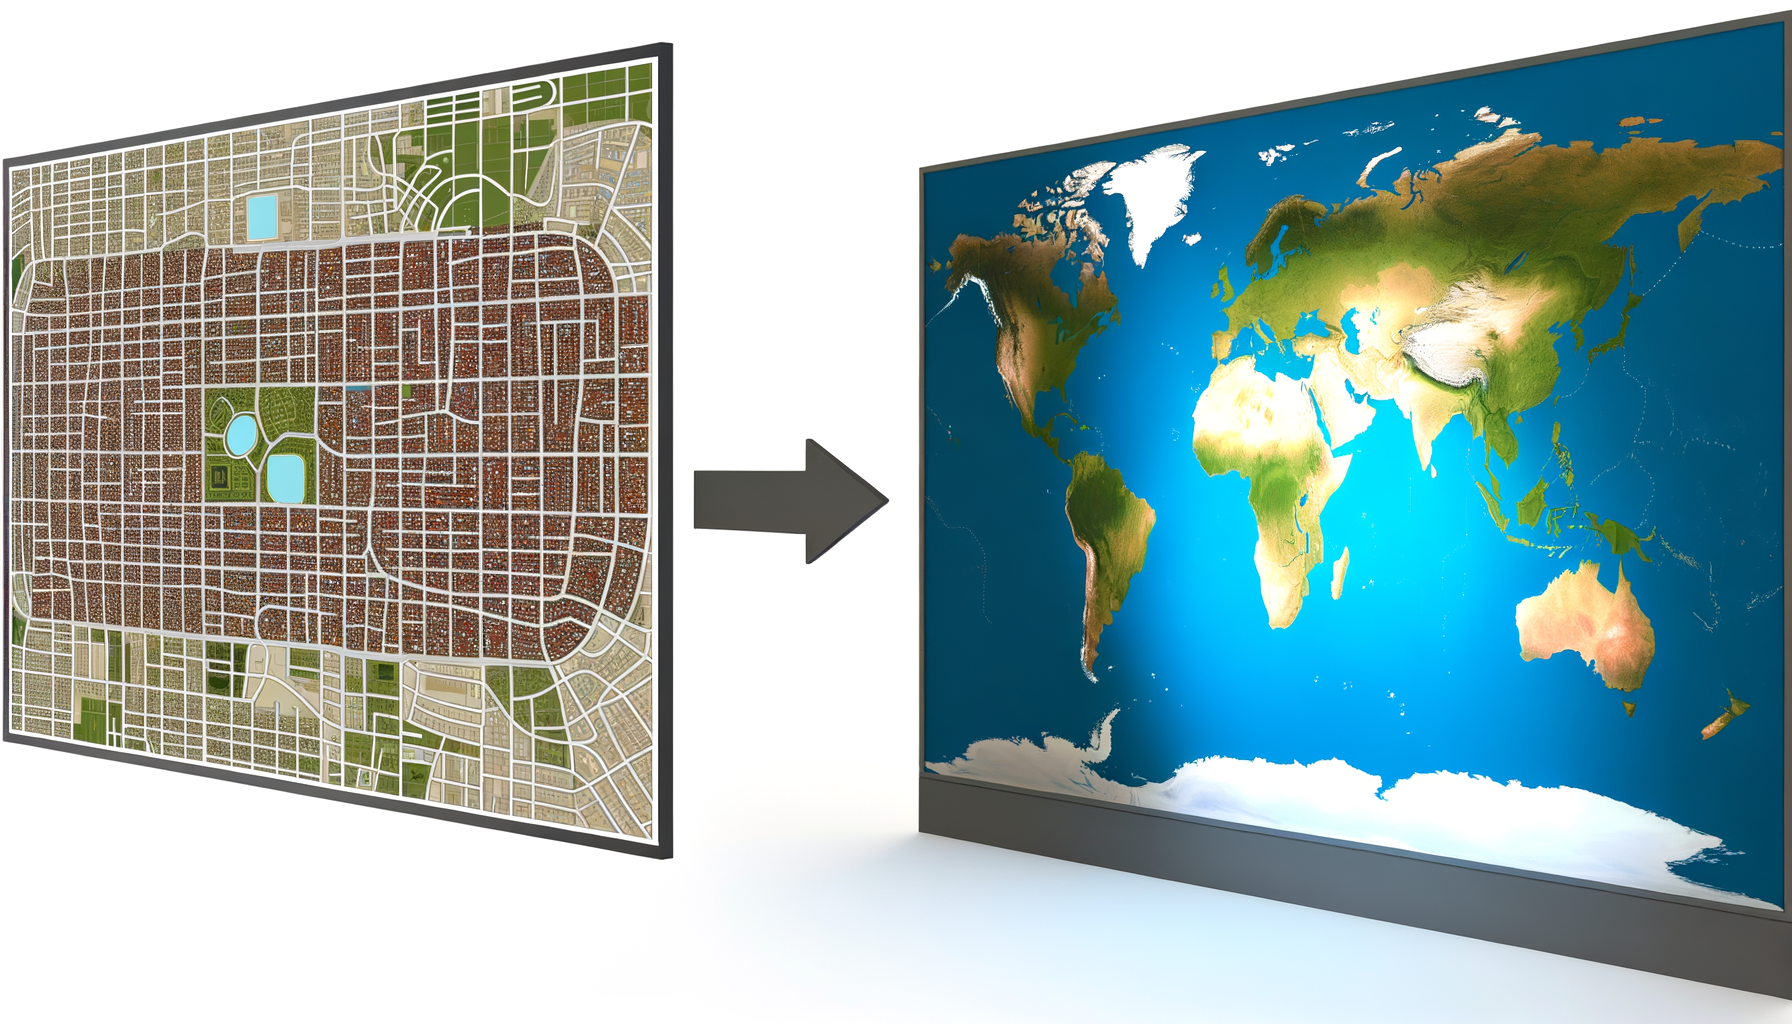
Understanding Map Scale: From Local Details to Global Perspectives
Maps are indispensable tools. They help us navigate our world, plan journeys, understand geography, and make informed decisions about places.
Yet, despite their ubiquity, one fundamental concept often remains a source of confusion for many users: map scale. It's the invisible hand that dictates how much of the world a map shows you, and how much detail it reveals.
Without grasping map scale, you might find yourself frustrated by a map that lacks the detail you need for a local hike, or conversely, overwhelmed by irrelevant features on a map intended for global comparison. This guide is designed to demystify map scale, taking you on a journey from understanding the fine details of a local map to appreciating the broad scope of a global one. We will explain what scale is, why it matters, explore the different ways it is represented, and show you how understanding scale is key to using any map effectively, no matter the application.
What is Map Scale? The Foundation of Cartography
At its core, map scale represents the relationship between a distance on a map and the corresponding distance on the ground. It is essentially a ratio or a fraction that tells you how much the real world has been reduced to fit onto your map. Every map has a scale, whether it is explicitly stated or not.
Understanding this ratio is crucial because it determines the level of detail you can expect to see and the total geographic area the map covers. A map covering a small area in great detail will have a different scale than a map covering a vast area with less detail.
Thinking of map scale is like choosing a camera lens. A wide-angle lens (small scale) captures a vast landscape but sacrifices fine detail in the distance. A telephoto lens (large scale) zooms in on a specific object, showing intricate textures and features, but captures only a small part of the overall scene. Map scale works on the same principle, balancing area coverage with the representation of features.
The Three Ways Scale is Expressed on a Map
Mapmakers use several standard ways to communicate the scale of a map to the user. Becoming familiar with each of these methods will help you quickly understand any map you encounter and interpret its scale correctly. While they look different, they all convey the same underlying ratio between map distance and real-world distance.
These three forms of scale expression are representative fraction, verbal scale, and graphic scale, each with its own advantages and typical use cases. Knowing how to read all three ensures you can determine the scale regardless of the map's design.
1. Representative Fraction (RF) or Ratio Scale
The representative fraction, often written as a ratio (e.g., 1:10,000) or a fraction (e.g., 1/10,000), is perhaps the most common and mathematically precise way to express map scale. In this format, the first number (always 1) represents a single unit of distance on the map. The second number represents the same unit of distance on the actual ground.
For example, a scale of 1:10,000 means that one unit of measurement on the map represents 10,000 of the *same* units on the ground. This unitless expression is powerful because it works with any unit of measurement – be it inches, centimeters, feet, or meters. If you measure one inch on the map with a 1:10,000 scale, that inch represents 10,000 inches on the ground. If you measure one centimeter, it represents 10,000 centimeters.
The key to understanding RF is that the unit is consistent on both sides of the ratio. A larger number on the right side of the ratio (the denominator) indicates a "smaller" scale map because each map unit represents a *larger* distance on the ground, covering a bigger area but with less detail. Conversely, a smaller number on the right side indicates a "larger" scale map, where each map unit represents a *smaller* distance on the ground, covering a smaller area but in much greater detail. This inverse relationship is fundamental to understanding scale types.
2. Verbal Scale or Statement Scale
A verbal scale expresses the relationship between map distance and ground distance in words. It is often stated as a simple sentence or phrase that is easy for anyone to understand without needing to perform calculations. Common examples include "one inch represents one mile" or "one centimeter represents 100 meters".
This format is intuitive because it directly links familiar units of measurement on the map (like inches or centimeters) to familiar units of measurement on the ground (like miles or kilometers). It is user-friendly and provides a clear sense of distance proportion.
However, a limitation of the verbal scale is that it relies on specific units of measurement. If the map user is more familiar with metric units while the verbal scale is given in imperial units, some mental conversion might be necessary. Also, if the map image is resized (like photocopying or viewing digitally at different zoom levels), the verbal scale statement becomes inaccurate, as the stated map unit no longer corresponds to the actual measurement on the resized map.
3. Graphic Scale or Bar Scale
The graphic scale is a visual representation of the map scale, usually appearing as a bar or line marked with divisions corresponding to distances on the ground. It looks like a small ruler printed directly on the map. This bar is labeled with real-world distances, such as miles, kilometers, or feet.
To use a graphic scale, you simply measure a distance on the map (perhaps using a ruler or even the edge of a piece of paper) and then compare that measurement to the graphic scale bar to determine the corresponding real-world distance. For example, you might find that the distance between two points on the map is exactly as long as the section of the bar scale marked "1 kilometer."
The significant advantage of the graphic scale is that it remains accurate even if the map is enlarged or reduced in size. If you photocopy a map at 50 percent reduction, the graphic scale bar shrinks by 50 percent along with the rest of the map features, maintaining the correct ratio between the map features and the scale bar. This makes the graphic scale the most reliable indicator of distance on a map that might be reproduced or displayed digitally at varying sizes. Many maps include both an RF and a graphic scale for versatility.
Scale and Detail: The Inverse Relationship Unpacked
Understanding the three ways scale is expressed is foundational, but the true power comes from recognizing the critical inverse relationship between the scale ratio and the level of detail shown on the map. This is where the concepts of "large scale" and "small scale" maps become meaningful. This relationship is often counter-intuitive initially because a "large" scale map covers a "small" area, and a "small" scale map covers a "large" area.
Let's clarify this using the representative fraction (RF). Remember, in an RF like 1:X, 'X' is the denominator. A *large* scale map has a *small* denominator (e.g., 1:1,000, 1:5,000, 1:24,000). A *small* scale map has a *large* denominator (e.g., 1:500,000, 1:1,000,000, 1:50,000,000).
Why is a small denominator called "large scale"? Because the reduction from reality is smaller. Each unit on the map represents a comparatively *short* distance on the ground. With less reduction, more features can be shown clearly and in greater detail within a given map size. This allows for the representation of individual buildings, narrow streets, small streams, and subtle changes in elevation. Consequently, a large scale map covers only a limited geographic area.
Conversely, why is a large denominator called "small scale"? Because the reduction from reality is much larger. Each unit on the map represents a comparatively *long* distance on the ground. To cover vast areas like continents or the entire world on a manageable page or screen, features must be generalized or omitted entirely. You won't see individual houses or small roads on a small scale map. Instead, cities might be represented by dots, roads by simplified lines, and complex coastlines smoothed out. The trade-off for covering a large area is the loss of fine detail. This is the core principle that distinguishes local-level maps from global-level maps.
Large Scale Maps: Zooming In On Your Local World
Large scale maps are your go-to resource when you need to understand and navigate small areas with high precision and detail. They typically have representative fractions with denominators ranging from 1:1 to around 1:50,000. Examples include scales like 1:1,200 (common for property maps), 1:5,000 (detailed urban planning maps), 1:10,000 or 1:24,000 (standard topographic maps in some countries).
These maps prioritize showing a wealth of information about a limited geographic extent. On a large scale map, you can expect to see intricate details that are essential for local navigation, planning, and analysis. Features commonly represented include individual buildings, precise property boundaries, utility lines, pedestrian walkways, street furniture, detailed topographic contours, and specific landmarks. Every bend in a small creek or every path in a park is likely to be depicted.
The high level of detail makes large scale maps invaluable for tasks requiring granular spatial understanding. They are fundamental tools for urban planning, emergency services, land surveying, real estate, detailed environmental assessments of small parcels, and recreational activities like hiking in specific areas.
Common Uses of Large Scale Maps
The applications of large scale maps are diverse and impact many aspects of daily life and professional work. Their ability to provide fine detail for small areas makes them irreplaceable for specific tasks.
For instance, city planners rely heavily on large scale maps (often 1:5,000 or larger) to design infrastructure, zone land use, and plan transportation networks. They need to see the precise layout of streets, placement of buildings, and location of parks and utilities.
Emergency responders use detailed street maps (large scale) to quickly locate addresses, identify access points, and understand the layout of buildings or neighborhoods during emergencies. Speed and accuracy in finding specific locations are paramount.
Surveyors and property assessors use very large scale cadastral maps (often 1:1,200 or 1:2,500) to define property lines, calculate land areas, and manage land records. These maps are legally binding documents requiring extreme precision.
Hikers and backpackers often use large scale topographic maps (like 1:24,000 or 1:25,000) to navigate trails, identify terrain features, estimate distances accurately, and plan routes based on elevation changes and ground cover. The contour lines showing elevation are particularly detailed at this scale.
Utility companies use large scale maps to document the location of pipes, cables, transformers, and other infrastructure. This is essential for maintenance, repairs, and planning for expansions. Even local businesses might use detailed maps of their immediate area for delivery planning or market analysis.
Small Scale Maps: Seeing the Global Perspective
Small scale maps, with their large denominators in the representative fraction (typically from 1:500,000 upwards, reaching into the millions or even billions for world maps), are designed to show large geographic areas. These maps sacrifice fine detail to provide a broad overview of regions, continents, or the entire planet. Examples include scales like 1:1,000,000 (common for aeronautical charts or regional planning), 1:10,000,000 (showing large countries or continents), and 1:50,000,000 or smaller (world maps).
The primary purpose of a small scale map is to illustrate large-scale patterns, distributions, and relationships across vast distances. On these maps, features are significantly generalized or simplified. Entire cities might be shown as single dots or symbols, major highways as thick lines, mountain ranges as shaded areas, and small rivers omitted entirely. Coastlines and boundaries are smoothed out, and intricate local features are invisible.
While they don't provide navigational detail for a specific street, small scale maps are invaluable for understanding global phenomena, comparing different regions, planning long-distance travel, and studying large-scale geographic trends. They offer context and perspective that large scale maps cannot.
Common Uses of Small Scale Maps
Small scale maps are essential tools for understanding and analyzing large-scale geographical patterns and for planning over vast distances. Their utility lies in their ability to present a broad, synoptic view.
World maps and maps of continents are classic examples of small scale maps, used extensively in education, atlases, and for general reference. They help us visualize the relative locations and sizes of countries, oceans, and major physical features like large mountain ranges or river systems.
Travelers planning international trips use small scale maps to understand the geography of different countries, major routes between cities, and the overall distance of their journey. They might then switch to larger scale maps for navigation within specific cities or regions.
Geographers and researchers use small scale maps to study global phenomena such as climate zones, population density patterns, distribution of natural resources, or migration routes. The ability to see the entire world or large regions at once is necessary for identifying these macro-level trends and spatial relationships.
Businesses involved in logistics, shipping, or international trade use small scale maps to plan global supply chains, shipping routes, and market reach. Understanding the distances and geographical barriers between continents is key to these operations.
Political scientists and historians might use small scale maps to analyze geopolitical boundaries, conflicts, and historical events on a global or regional stage. These maps provide the necessary context for understanding spatial power dynamics. Even weather maps, which show large-scale weather patterns over continents or oceans, are forms of small scale maps.
Large vs. Small Scale: A Direct Comparison
Let's synthesize the key differences between large scale and small scale maps to solidify your understanding. The distinction is not just academic; it dictates what kind of information a map can provide and what tasks it is suitable for. Thinking about the "zoom level" is often helpful.
Area Covered: Large scale maps cover a *small* geographic area (like a neighborhood, city, or a section of a park). Small scale maps cover a *large* geographic area (like a country, continent, or the whole world).
Level of Detail: Large scale maps show *high* levels of detail, depicting small features like individual buildings, street furniture, and precise property lines. Small scale maps show *low* levels of detail, generalizing or omitting small features and showing only major landmarks, cities (as points), and large geographical features.
Representative Fraction Denominator: Large scale maps have a *small* denominator (e.g., 1:5,000). Small scale maps have a *large* denominator (e.g., 1:50,000,000). Remember, smaller number = larger scale = more detail, smaller area.
Purpose: Large scale maps are used for *local* planning, navigation, detailed analysis, and tasks requiring precision within a limited area. Small scale maps are used for *global* or *regional* overview, understanding large-scale patterns, and planning long-distance travel.
Generalization and Distortion: Large scale maps have minimal generalization and relatively low distortion within the map area. Small scale maps require significant generalization (simplification of features) and exhibit greater distortion due to the challenge of representing the curved Earth on a flat surface over a vast area.
Understanding which scale is appropriate for your needs is the first step in effectively using any map. You wouldn't use a world map to navigate city streets, nor would you use a street map to plan a flight across the Atlantic.
Why Understanding Map Scale is Crucial
Beyond simply reading a map, a solid understanding of map scale is vital for a multitude of reasons across various disciplines and everyday situations. It informs our perception of distance, size, and geographical relationships. Failing to consider scale can lead to misinterpretations, errors in planning, and an incomplete understanding of spatial data.
In navigation, whether you are using a paper map or a digital one, knowing the scale helps you estimate travel times, understand the proximity of landmarks, and choose the most appropriate route. A cyclist navigating city streets needs a much larger scale map than a driver planning a cross-country road trip.
For anyone involved in land use planning, environmental studies, or resource management, scale is a fundamental consideration. Analyzing soil types or vegetation patterns requires large scale maps of specific areas, while studying climate change impacts or deforestation rates often necessitates small scale maps covering large regions or the entire globe. The scale of your analysis must match the scale of the phenomena you are studying.
In education, teaching map scale is essential for developing spatial literacy among students. It helps them grasp relative size, distance, and the concept of representation. Learning to switch between thinking locally (large scale) and thinking globally (small scale) is a key geographical skill.
Businesses use scale in market analysis, site selection, and logistics. Understanding the population distribution at a neighborhood level (large scale) is different from analyzing regional market trends (small scale). Choosing the right scale of map data is critical for accurate business intelligence.
Ultimately, understanding scale empowers you to choose the correct map for a given task, interpret the information presented on the map accurately, and critically evaluate the level of detail and potential distortions inherent in the map's representation of reality. It transforms a simple image into a powerful analytical tool.
The Challenge of Representation: Scale, Generalization, and Distortion
As we move from large scale maps (showing small areas with high detail) to small scale maps (showing large areas with low detail), two related cartographic challenges become increasingly significant: generalization and distortion. These are inherent aspects of mapmaking, especially when representing a three-dimensional, curved surface (the Earth) on a two-dimensional, flat plane (a map).
Generalization is the process of simplifying features on a map due to the reduction in scale. As less space is available on the map to represent the same real-world area, features must be less detailed or even omitted. This can involve:
1. Simplification: Winding roads or coastlines might be drawn with fewer wiggles.
2. Selection: Only major rivers or cities are shown, while smaller ones are left out.
3. Aggregation: Multiple small buildings might be represented as a single block.
4. Displacement: Closely spaced features might be moved slightly apart to make them distinguishable.
5. Symbolization: Using symbols or area fills instead of drawing features to scale (e.g., a city symbol instead of a detailed street grid).
Generalization is necessary to make small scale maps legible and understandable; without it, they would be cluttered and impossible to read. However, it means that information is lost or altered in the transition from large scale reality to small scale representation. You need to be aware that a small scale map is a *generalized* view of the world.
Distortion arises from the unavoidable process of map projection – transforming the spherical Earth onto a flat surface. No flat map can perfectly preserve all spatial properties (area, shape, distance, direction) simultaneously for the entire globe. Map projections are chosen based on which properties are most important to preserve for a given purpose and location, but others will be distorted.
At large scales, covering very small areas, the curvature of the Earth is negligible. Imagine mapping a single building or a city block. The distortion introduced by treating this tiny area as flat is minimal, and most geometric properties are preserved quite accurately. This is why large scale maps are excellent for measuring precise distances and areas within their limited coverage.
However, as the map scale gets smaller and the area covered gets larger (regional, continental, global), the Earth's curvature becomes significant. Projecting these vast areas onto a flat map introduces noticeable distortion in shape, area, distance, or direction, depending on the specific projection used. For example, the Mercator projection, commonly used for world maps (small scale), severely distorts areas near the poles, making Greenland appear much larger than South America, when in reality South America is nine times larger.
Therefore, while small scale maps are excellent for showing relative locations and broad patterns, you must be cautious when trying to measure distances or compare areas directly, especially across different parts of the map. The chosen map projection and the inherent distortion at small scales mean that measurements can be inaccurate. Understanding scale means understanding the compromises mapmakers have made in representing the world.
Choosing the Right Scale for Your Needs
With an understanding of how scale works and the differences between large and small scale maps, you are now equipped to choose the most appropriate map for any given task. Selecting the right scale is crucial for efficiency and accuracy.
Start by asking yourself: What area do I need to cover? Do I need to see a specific building, a neighborhood, a city, a region, a country, or the entire world? This immediately guides you towards either a large or small scale map. If you need to navigate a few city blocks, you need a large scale map. If you are planning a road trip across several states, a medium to small scale regional map is more appropriate. If you are studying global trade flows, you need a very small scale world map.
Next, consider the level of detail you require. Do you need to see individual streets, property lines, and small topographical features? If so, a large scale map is essential. Or do you just need to see major highways, cities, and country borders? In that case, a small scale map will suffice and be less cluttered.
Think about the purpose of using the map. Is it for precise measurement and detailed analysis (large scale)? Or is it for understanding broad patterns and relative locations over vast distances (small scale)? The purpose often dictates the necessary level of detail and area coverage.
Finally, consider the format. Are you working with a paper map that needs to fit on a table, or a digital map where you can zoom in and out? While digital maps allow for changing views, the underlying data often has a native scale at which it is most accurate or complete. Understanding that native scale is still important, even if the display allows for seamless zooming. Most digital mapping services like Google Maps or OpenStreetMap use data compiled at various scales, which are presented dynamically as you zoom. However, even here, the concept of scale limits what can be shown at any given zoom level. At a highly zoomed-in view, you're seeing data akin to a large scale map; zoomed out, you're seeing data akin to a small scale map, with generalization applied automatically.
Making a conscious decision about the required scale before selecting or creating a map will save you time and ensure that the map serves its intended purpose effectively. It is a fundamental step in geospatial problem-solving.
Conclusion: Scale - Your Key to Unlocking Map Power
Map scale is far more than just a number or a bar on a map; it is the fundamental concept that defines a map's utility, its limitations, and the perspective it offers on the world. We have journeyed from understanding the basic definition of scale and its different forms of expression to exploring the crucial distinction between large scale maps, which reveal the intricate details of our local environments, and small scale maps, which provide sweeping views of regions and the globe.
We've seen how the inverse relationship between the scale denominator and the level of detail shapes what information a map can effectively convey. Large scale maps are indispensable for tasks requiring precision and granular information over limited areas, serving everyone from hikers and urban planners to emergency responders and property surveyors. Small scale maps, while sacrificing fine detail, are essential for understanding macro-level patterns, planning long-distance travel, and analyzing global phenomena, proving invaluable to geographers, international businesses, and educators.
We've also touched upon the unavoidable challenges of generalization and distortion, recognizing that representing a curved world on a flat map, especially at small scales, involves necessary compromises that users must be aware of. Understanding these compromises helps in interpreting map information accurately.
Ultimately, mastering map scale is about gaining spatial literacy. It empowers you to select the most appropriate map for your specific needs, interpret the information it presents with critical awareness, and better understand the relationship between different places and geographical features at varying levels of detail.
Whether you are planning a trip, conducting research, working in a professional field that uses spatial data, or simply curious about the world around you, taking the time to understand map scale will significantly enhance your ability to read, use, and appreciate maps. It's the essential key that unlocks the true power and versatility of cartography, allowing you to navigate and understand the world, from the smallest local corner to the vastness of the entire planet. Start by looking at the scale on the next map you encounter, and you will see the world with a new perspective.