


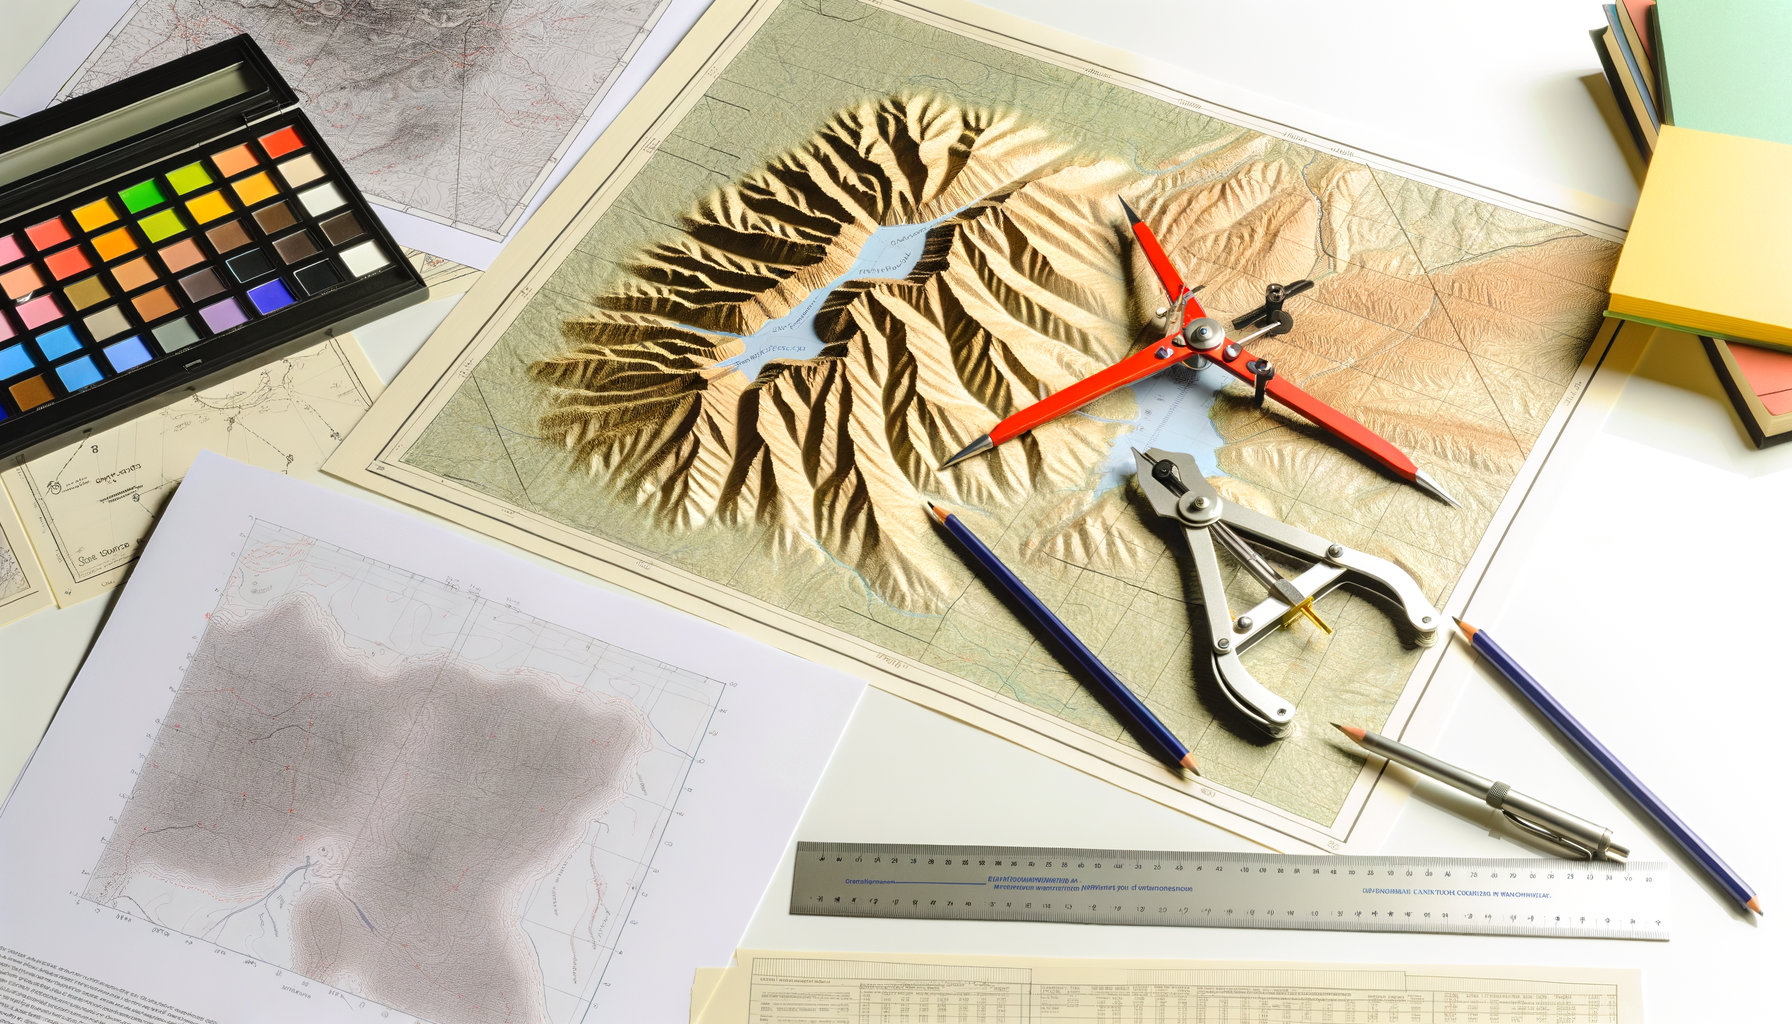
More Than Just a Flat Picture: The Allure of Raised Relief Maps
For centuries, maps have been indispensable tools for navigating our world, recording history, and understanding geography. While traditional flat maps excel at depicting locations, boundaries, and routes, they often struggle to convey one of Earth's most fundamental characteristics: its topography. The rolling hills, soaring mountains, and deep valleys that shape landscapes are challenging to represent on a two-dimensional surface in a truly intuitive way.
This is where raised relief maps step in, offering a unique, tactile dimension to cartography. By physically elevating the landforms, these maps provide an immediate, graspable understanding of terrain that flat maps, even with sophisticated contour lines or shading, cannot fully replicate. They allow users to literally feel the elevation changes, providing a tangible connection to the geography of a region.
Have you ever run your fingers over the bumpy surface of a raised relief map, tracing the ridge lines of a mountain range or feeling the slope of a plateau? There is a distinct sense of wonder and comprehension that comes from experiencing geography in this physical form. It makes abstract data about elevation concrete and accessible.
But how are these fascinating three-dimensional representations created? What scientific principles and technological processes transform flat data and plastic sheets into accurate, touchable landscapes? This isn't a simple task; it requires a blend of advanced data acquisition, digital processing, precision printing, and specialized manufacturing techniques.
This article delves into the intricate science and technology behind the creation of raised relief maps. We will explore the journey from capturing the initial elevation data to the final stages of physically forming the three-dimensional shape. By understanding the processes involved, we gain a deeper appreciation for these remarkable cartographic tools and the scientific innovation they represent. We will uncover the solutions that cartographers and manufacturers employ to bring the Earth's surface into your hands.
The Foundation: Capturing the Earth's Elevation
Every raised relief map begins not with plastic or molds, but with data – specifically, accurate information about the elevation of the Earth's surface. Without precise measurements of height above sea level, creating a truthful three-dimensional model would be impossible. Over time, the methods for obtaining this crucial data have evolved dramatically, moving from painstaking manual labor to highly sophisticated remote sensing technologies.
Understanding how this foundational data is collected is the first step in appreciating the science behind the final map product. The accuracy and resolution of the initial data directly impact the level of detail and fidelity achievable in the raised relief.
Traditional Surveying Methods
In the past, gathering elevation data was a slow and arduous process, relying on ground-based surveying techniques. Surveyors would use tools like theodolites, levels, and measuring chains to determine the precise positions and elevations of points across a landscape. This involved establishing benchmarks and painstakingly triangulating or leveling between points.
While incredibly accurate for specific points, these methods were labor-intensive and time-consuming, making it difficult and expensive to survey large areas in detail. Creating a comprehensive topographic map for even a moderate-sized region could take years, involving teams of surveyors working in challenging conditions. This historical context highlights the monumental effort that went into early topographic mapping and serves as a backdrop for the revolutionary changes brought by modern technology.
The Digital Revolution: Remote Sensing
The advent of aerial photography and later, satellite technology, ushered in an era of remote sensing, fundamentally changing how we collect geographic data, including elevation. Remote sensing allows us to gather information about the Earth's surface from a distance, typically from aircraft or satellites, enabling faster, more comprehensive, and often more cost-effective data acquisition over vast areas. This transition was pivotal for making detailed elevation data widely available.
Aerial Photography and Photogrammetry
One of the earliest forms of remote sensing used for topography was aerial photography. By taking overlapping photographs of the ground from an airplane, technicians could use a technique called photogrammetry to derive three-dimensional information. Photogrammetry involves measuring distances, angles, and areas from these photographs.
Using specialized stereoplotter equipment (or increasingly, sophisticated software), operators could view pairs of overlapping photos stereoscopically, creating a 3D model in their minds or on a screen. From this perceived 3D model, they could trace contour lines or extract spot elevations, creating topographic maps. While a significant leap forward from ground surveying, photogrammetry requires clear visibility, is affected by shadows, and the accuracy can depend on the quality of the photographs and the skill of the operator.
Satellite Remote Sensing: DEMs from Orbit
Satellites equipped with various sensors further revolutionized elevation data collection. Techniques like radar interferometry involve sending microwave pulses from a satellite to the Earth's surface and measuring the time it takes for the signal to return. By comparing radar signals collected from slightly different positions or at different times, scientists can calculate very precise ground surface elevations.
Major satellite missions have provided foundational global elevation datasets. The Shuttle Radar Topography Mission (SRTM), flown in 2000, collected elevation data for over 80 percent of Earth's landmass, providing a dataset that was unprecedented in its coverage. More recent missions, like the Advanced Spaceborne Thermal Emission and Reflection Radiometer (ASTER) on NASA's Terra satellite, also contribute to global Digital Elevation Models (DEMs). These satellite-derived DEMs provide a grid of elevation points covering large areas, although their resolution can be coarser than data from other methods.
LiDAR (Light Detection and Ranging)
Perhaps the most advanced and precise method for collecting high-resolution elevation data is LiDAR. LiDAR systems, typically mounted on aircraft or drones, emit rapid pulses of laser light towards the ground. Sensors measure the time it takes for each pulse to return after hitting a surface. Since the speed of light is constant and the position of the aircraft is known via GPS, the system can calculate the distance to the ground for each laser pulse.
A single LiDAR scan can capture millions of elevation points per second, creating an incredibly dense and detailed point cloud of the landscape. Critically, LiDAR can penetrate vegetation canopy to some extent, allowing it to map the actual ground surface below trees, which is a major advantage over photogrammetry in forested areas. This technology provides the raw data for creating highly accurate and detailed DEMs, essential for producing high-fidelity raised relief maps.
From Data to Model: Processing the Elevation Data
Once the raw elevation data is collected, whether from traditional surveys, photogrammetry, satellite radar, or LiDAR, it needs to be processed and prepared for use in creating a physical map. This stage involves complex computational steps to transform millions or billions of individual elevation points into a usable digital model and integrate it with other geographic information. This digital processing phase is critical for ensuring the accuracy and visual effectiveness of the final product.
Understanding this intermediate step reveals how raw measurements become the structured information required for manufacturing a raised relief map. It's where the 'science' of data meets the art and engineering of cartographic representation.
Digital Elevation Models (DEMs) Explained
The primary output of modern elevation data collection is typically a Digital Elevation Model (DEM). A DEM is a gridded representation of the Earth's surface, where each cell or pixel in the grid has a value representing the elevation at that location. Imagine a vast checkerboard laid over the landscape; each square on the checkerboard is assigned a height.
The resolution of a DEM refers to the size of each grid cell (e.g., 1-meter resolution means each cell is 1 meter by 1 meter). Higher resolution DEMs capture finer details of the terrain but also result in much larger datasets requiring significant processing power. DEMs can be derived from various sources like LiDAR (very high resolution), photogrammetry, or satellite data (often lower resolution but wider coverage). They form the digital blueprint for the 3D shape of the raised relief map.
Vertical Exaggeration: Making Mountains Stand Out
A crucial step in preparing a DEM for a raised relief map is applying vertical exaggeration. If a map were created using a 1:1 scale for both horizontal distance and vertical elevation, the relief would often appear almost flat. For example, Mount Everest, the world's tallest mountain, rises about 8,848 meters (about 5.5 miles) above sea level. If a map of the Himalayas had a horizontal scale where 1 inch represented 5.5 miles, Mount Everest would only rise 1 inch off the map surface. This would barely be perceptible to the touch or eye on a map covering a large area.
To make the topography visually and tactilely apparent, the vertical scale is stretched relative to the horizontal scale. This is called vertical exaggeration. A map might have a vertical exaggeration factor of 5x, 10x, or even more. This means that every meter of actual elevation is represented by 5, 10, or more times the distance that a meter of horizontal distance is represented on the map.
While necessary for clarity, vertical exaggeration is a form of distortion. It changes the apparent steepness of slopes and the relative heights of features. Steep canyons might look impossibly sheer, and gentle hills might appear as significant bumps. Choosing the appropriate level of exaggeration is a cartographic decision that balances the need for visual impact and tactile feel with the goal of representing the terrain truthfully, albeit with a calculated distortion. The chosen exaggeration factor is applied mathematically to every elevation point in the DEM.
Designing the Base Map: Adding Detail and Context
A raised relief map isn't just a 3D shape; it also includes traditional map information printed on its surface. This involves designing and printing a conventional topographic map – complete with political boundaries, cities, roads, rivers, lakes, and potentially contour lines or shaded relief – that will be overlaid onto the 3D form. This base map provides geographical context and allows users to locate features on the raised topography.
The design of this base map must be carefully coordinated with the 3D data. The printed features must align precisely with the underlying terrain model. For example, a river printed on the flat sheet must follow the valley carved out in the 3D model, and a mountain peak symbol must sit exactly on the highest point of the raised mountain. This requires skilled graphic design and precise georeferencing of the printed artwork to the DEM data. The final digital output from this stage is essentially a high-resolution, color-accurate image file ready for printing, paired with the processed, vertically exaggerated DEM ready for mold creation.
Bringing it to Life: The Physical Creation Process
With the digital blueprint complete – the processed DEM for the 3D shape and the designed base map for the printed layer – the process moves from the digital realm to the physical. This stage involves specialized manufacturing techniques to translate the digital data into a tangible, three-dimensional object. It is here that engineering and materials science play a central role, culminating in the technique of vacuum forming.
The creation of the physical relief map requires precision in several steps: printing the base map accurately, creating a physical mold that replicates the exaggerated terrain, and then using heat and vacuum pressure to form a plastic sheet over that mold, all while ensuring the printed map aligns perfectly with the plastic's new shape.
Printing the Base Map
The first physical step is typically printing the carefully designed base map onto a sheet of material that can withstand the subsequent heat and stretching of the forming process. This material is usually a thin, flexible plastic sheet, such as styrene or PVC. High-quality, large-format printers are used to ensure accuracy and vibrant colors.
Because the plastic will be stretched during the forming process, the base map print cannot simply be the standard map layout. The artwork must be pre-distorted or compensated to account for how it will stretch over the 3D form. Areas that will be stretched more (like slopes and peaks) need their corresponding artwork compressed on the flat sheet so that they appear correctly proportioned once the plastic is formed. This pre-distortion calculation is a complex step requiring precise knowledge of the forming process and the material properties.
Creating the Mold
The heart of the physical process is the mold. This is a rigid, three-dimensional negative or positive representation of the terrain that the heated plastic will be formed onto. The accuracy and detail of the mold directly determine the quality and fidelity of the final raised relief map. Creating this mold is a critical step, often involving significant engineering and craftsmanship.
Traditional Mold Making
Historically, molds were often created manually or using mechanical processes. One method involved creating a series of contour layers cut from rigid material (like cardboard or plastic sheets) based on contour lines from the topographic map. These layers would be stacked and glued together to build up a stepped representation of the terrain. The steps would then be filled in and smoothed by hand using materials like plaster, clay, or resin to create a continuous, smooth surface replicating the landforms.
While labor-intensive and requiring significant artistic skill, this method allowed for the creation of molds for areas where digital data was scarce or for custom, artistic maps. However, it was prone to inconsistencies and difficult to achieve high levels of detail based solely on contour lines.
Digital Mold Creation (CNC Milling, 3D Printing)
Today, molds are predominantly created using digital manufacturing techniques driven directly by the processed DEM data. Computer Numerical Control (CNC) milling is a common method. A block of durable material, such as tooling board, foam, or even metal, is placed in a milling machine. The machine uses the 3D data from the DEM (scaled and exaggerated) to precisely cut away material, carving out the terrain shape layer by layer using various bits. This process is highly accurate and repeatable, directly translating the digital model into a physical form.
Another increasingly viable method is large-format 3D printing. The 3D printer builds the mold layer by layer using materials like plastic or resin, guided by the digital terrain model. While potentially slower for very large molds than milling, 3D printing can create intricate details and complex shapes directly from the digital file with high precision, especially useful for smaller, highly detailed maps or specific geographic features.
Whether milled or 3D printed, the resulting mold must be durable, able to withstand heat and pressure, and often includes small ventilation holes to assist in the vacuum forming process. It is a positive mold, meaning its surface is the hills and valleys of the landscape, onto which the heated plastic sheet will be pulled down.
The Heart of the Process: Vacuum Forming
Vacuum forming is the core manufacturing process that gives the map its three-dimensional shape. It is a relatively simple but highly effective thermoforming technique used for shaping plastic sheets. The science behind it relies on the properties of thermoplastics – plastics that become pliable when heated and solidify when cooled, retaining their new shape.
The process involves heating a sheet of thermoplastic material (in this case, the sheet with the pre-distorted base map printed on it) until it is soft and flexible. The heated sheet is then placed over the mold. A vacuum is applied, sucking the air out from between the plastic sheet and the mold. The atmospheric pressure on the other side of the plastic sheet then pushes it down firmly onto the surface of the mold, forcing it to take on the mold's exact shape.
The Vacuum Forming Principle
At its heart, vacuum forming utilizes atmospheric pressure. When the air is evacuated from beneath the heated plastic sheet and the mold, the standard atmospheric pressure (which is quite significant, about 14.7 pounds per square inch at sea level) pressing down on the upper surface of the plastic becomes the dominant force. This external pressure differential is what pulls the softened plastic into intimate contact with every curve and detail of the mold's surface. It's a simple yet powerful application of physics to manipulate material.
Materials Used (Plastics)
Several types of thermoplastic sheets can be used for vacuum forming relief maps, with common choices including styrene, PVC, and sometimes PETG. The selection depends on factors like durability, flexibility, ease of printing, forming characteristics (how well it stretches and holds detail), and cost. These plastics are chosen because they become maleable at temperatures achievable with industrial heating elements but are rigid enough at room temperature to hold their shape and withstand handling after forming. The thickness of the plastic sheet also impacts the final feel and durability of the map.
The Heating and Molding Steps
The process typically involves several key steps within a vacuum forming machine:
1. Clamping: The pre-printed plastic sheet is securely clamped into a frame, suspending it horizontally.
2. Heating: Radiant heating elements are used to heat the plastic sheet uniformly from above and/or below until it reaches its optimal forming temperature – pliable but not molten or degraded. The temperature and heating time are critical and depend on the specific type and thickness of the plastic.
3. Forming: The heated, softened sheet is lowered onto the mold, which is positioned on a platen with small vacuum holes. A vacuum pump is activated, rapidly evacuating the air from the cavity between the plastic and the mold. The external atmospheric pressure forces the plastic down onto the mold, replicating its shape.
4. Cooling: Once the plastic has taken the shape of the mold, it must be cooled sufficiently for it to solidify and hold its new, permanent form. Fans or chilled air may be used to speed up the cooling process while the plastic is still held under vacuum or positive pressure.
5. De-molding: Once cooled and rigid, the vacuum is released, and the formed plastic sheet is removed from the mold.
The success of this step depends on precise control of temperature, heating time, vacuum pressure, and cooling. Any inconsistencies can lead to uneven stretching, loss of detail, or imperfections in the formed plastic. The pre-distortion applied to the printed artwork earlier in the process now pays off, as the stretched print aligns with the physical peaks and valleys of the formed plastic.
Finishing Touches: Trimming, Coloring, and Details
After vacuum forming, the sheet contains one or more formed map sections, depending on how the mold was designed. These sections need to be processed further to become finished products. The excess plastic around the formed map area is trimmed away using automated cutting machines or manual methods. Precision trimming is essential to create clean edges and separate individual maps if multiple were formed on a single sheet.
Sometimes, additional coloring or finishing might be applied after forming, although the primary color and detail are usually part of the initial print. Protective coatings or laminates might be added to improve durability and appearance. For some maps, mounting onto a rigid backing board is the final step, providing stability and making the map easier to display and handle. The final product is a durable, lightweight, three-dimensional map ready for distribution and use.
Ensuring Accuracy and Dealing with Challenges
While the process of creating raised relief maps is sophisticated, it is not without its challenges. Achieving high accuracy and representing the Earth's complex surface faithfully, even with vertical exaggeration, requires careful attention to detail at every stage. Several factors can influence the final quality and the viewer's perception of the terrain.
Understanding these challenges provides insight into the complexities of cartographic representation and the compromises sometimes necessary when translating three-dimensional reality into a scaled, physical model. Accuracy in raised relief mapping is a nuanced concept, involving both the fidelity to the source data and the effectiveness of its visual and tactile communication.
Data Resolution and Quality
The quality of the initial elevation data is paramount. A low-resolution DEM will result in a mold that lacks fine detail, producing a map with rounded features and missing smaller terrain variations like gullies or rocky outcrops. Errors in the source data, whether from acquisition artifacts or processing errors, will be directly replicated in the physical mold and thus in the final map.
Using high-resolution data sources like LiDAR is ideal for detailed maps, but such data is not available everywhere globally and can be expensive to acquire and process. Cartographers must often work with the best available data, understanding its limitations and how it will impact the final raised relief product. The 'science' here involves selecting appropriate data and managing its inherent imperfections.
The Impact of Vertical Exaggeration on Perception
As discussed earlier, vertical exaggeration is essential for visibility but inherently distorts the landscape's true proportions. While necessary, it can lead users to perceive slopes as steeper or features as taller than they are in reality. This is a cartographic compromise – prioritizing clear communication of relative height and form over a strictly scale model.
Map makers must clearly state the horizontal and vertical scales, including the exaggeration factor, so users understand the distortion. However, the tactile nature of the map can sometimes make it easy to forget the applied exaggeration, leading to a potentially skewed mental model of the terrain's true steepness. The science considers human perception and how to best convey information despite necessary distortions.
Physical Limitations of the Process
The vacuum forming process itself has limitations in replicating extremely fine details. The heated plastic sheet, while pliable, has a minimum thickness and a certain stiffness. It cannot perfectly flow into infinitesimally small crevices or replicate razor-sharp ridges found on the mold, especially at smaller scales or with thicker plastics. Very fine details might be slightly rounded or softened during forming.
Furthermore, the stretching of the plastic is not perfectly uniform, especially over complex shapes. This non-uniform stretching is why the pre-distortion of the printed artwork is necessary and is a complex calculation based on material properties and mold geometry. Despite these calculations, minor misalignments between the print and the formed plastic can sometimes occur, particularly in areas of extreme stretching. These are engineering challenges that require careful control of materials and process parameters.
Evolution and the Future of Relief Mapping
While the core vacuum forming process for creating physical raised relief maps has been around for decades, the technologies feeding into and complementing it continue to evolve. The future of relief mapping involves not only refinements in the physical manufacturing process but also deeper integration with digital technologies and new approaches to interacting with geographic data.
The science and technology continue to push the boundaries of detail, accuracy, and accessibility in representing the Earth's surface in three dimensions. This evolution ensures that raised relief maps, or their modern counterparts, remain relevant tools for education, planning, and exploration.
Integration with Digital Technologies
High-resolution DEMs and 3D models created for physical map production can also power digital experiences. This includes interactive 3D visualizations on screens, fly-through simulations, and integration with Geographic Information Systems (GIS).
Emerging technologies like Augmented Reality (AR) and Virtual Reality (VR) offer exciting possibilities for terrain visualization. Imagine pointing your phone at a physical raised relief map and seeing digital information – like trail names, historical data, or real-time weather – overlaid directly onto the physical peaks and valleys via AR. Or stepping into a VR environment that immerses you within a highly detailed, scale-accurate 3D landscape derived from the same data used to make the physical map. These digital integrations enhance the value and utility of the underlying elevation data.
New Materials and Techniques
Research into new thermoplastic materials could lead to maps with increased durability, finer detail reproduction, or different tactile properties. Advances in 3D printing technology are also making it possible to print highly detailed, multi-material 3D terrain models directly, potentially bypassing the traditional mold-making and vacuum forming process entirely for certain applications or scales. While vacuum forming remains cost-effective for mass production, direct 3D printing allows for unparalleled customization and complexity in one-off or small-batch models.
Accessibility and Customization
With more readily available high-resolution data and increasingly accessible digital manufacturing tools, creating custom raised relief maps is becoming more feasible. Individuals, educators, or organizations can potentially create maps of specific, smaller areas with high detail, tailored to their particular needs. This democratization of the production process could lead to wider use of tactile geographic representations beyond traditionally published maps.
Conclusion: The Enduring Appeal of Tactile Geography
The science behind raised relief maps is a fascinating convergence of data acquisition, digital processing, materials science, and manufacturing engineering. From the satellite capturing elevation data orbiting the Earth to the precision laser pulses of a LiDAR scanner, and from the complex calculations for vertical exaggeration and print distortion to the heat and vacuum pressure of the forming machine, each step is a testament to human ingenuity in understanding and representing our planet.
These maps are far more than simple curiosities; they are powerful educational tools that provide a level of understanding and engagement with topography that flat maps struggle to match. Feeling the contours of a mountain range or the depth of a valley creates a lasting spatial understanding.
Despite the rise of sophisticated digital mapping tools, the physical, tactile nature of a raised relief map ensures its continued value and appeal. It offers a direct, intuitive connection to the landforms it represents. The science and technology behind their creation enable us to hold a piece of the Earth's surface in our hands, bringing geography to life in a uniquely tangible way. They stand as enduring examples of how scientific principles and technological processes can be combined to create both informative and aesthetically compelling representations of our world.