


Using Raised Relief Maps to Teach Natural Disasters
Unlock Deeper Understanding: Why Raised Relief Maps Are Essential for Teaching Natural Disasters
Teaching students about natural disasters presents a unique challenge. These events, while critical for understanding our planet's dynamic processes and human vulnerability, often involve complex geographical and geological concepts that are difficult to visualize and grasp fully from flat maps or two-dimensional diagrams alone.
How does the shape of the land influence where a flood occurs, the path of a lava flow, or the impact of a storm surge? How do invisible fault lines beneath the surface connect to the dramatic mountain ranges visible above? These crucial connections, vital for comprehending the 'why' and 'where' of natural hazards, are often lost in translation.
Educators and students alike need tools that can bridge the gap between abstract data and tangible reality, making the terrifying power and geographical context of natural disasters understandable and less intimidating through knowledge. This is where raised relief maps offer a powerful, often underutilized, solution.
This post will explore why raised relief maps are exceptionally effective tools for teaching about natural disasters. We will delve into their unique advantages, provide practical strategies for integrating them into your curriculum, and discuss how they can help students develop a profound spatial understanding of the risks our world faces, preparing them not just intellectually, but also fostering a sense of informed awareness.
What Exactly Are Raised Relief Maps?
Before diving into their specific applications for natural disasters, let's clarify what raised relief maps are and how they differ from the standard flat maps we commonly encounter.
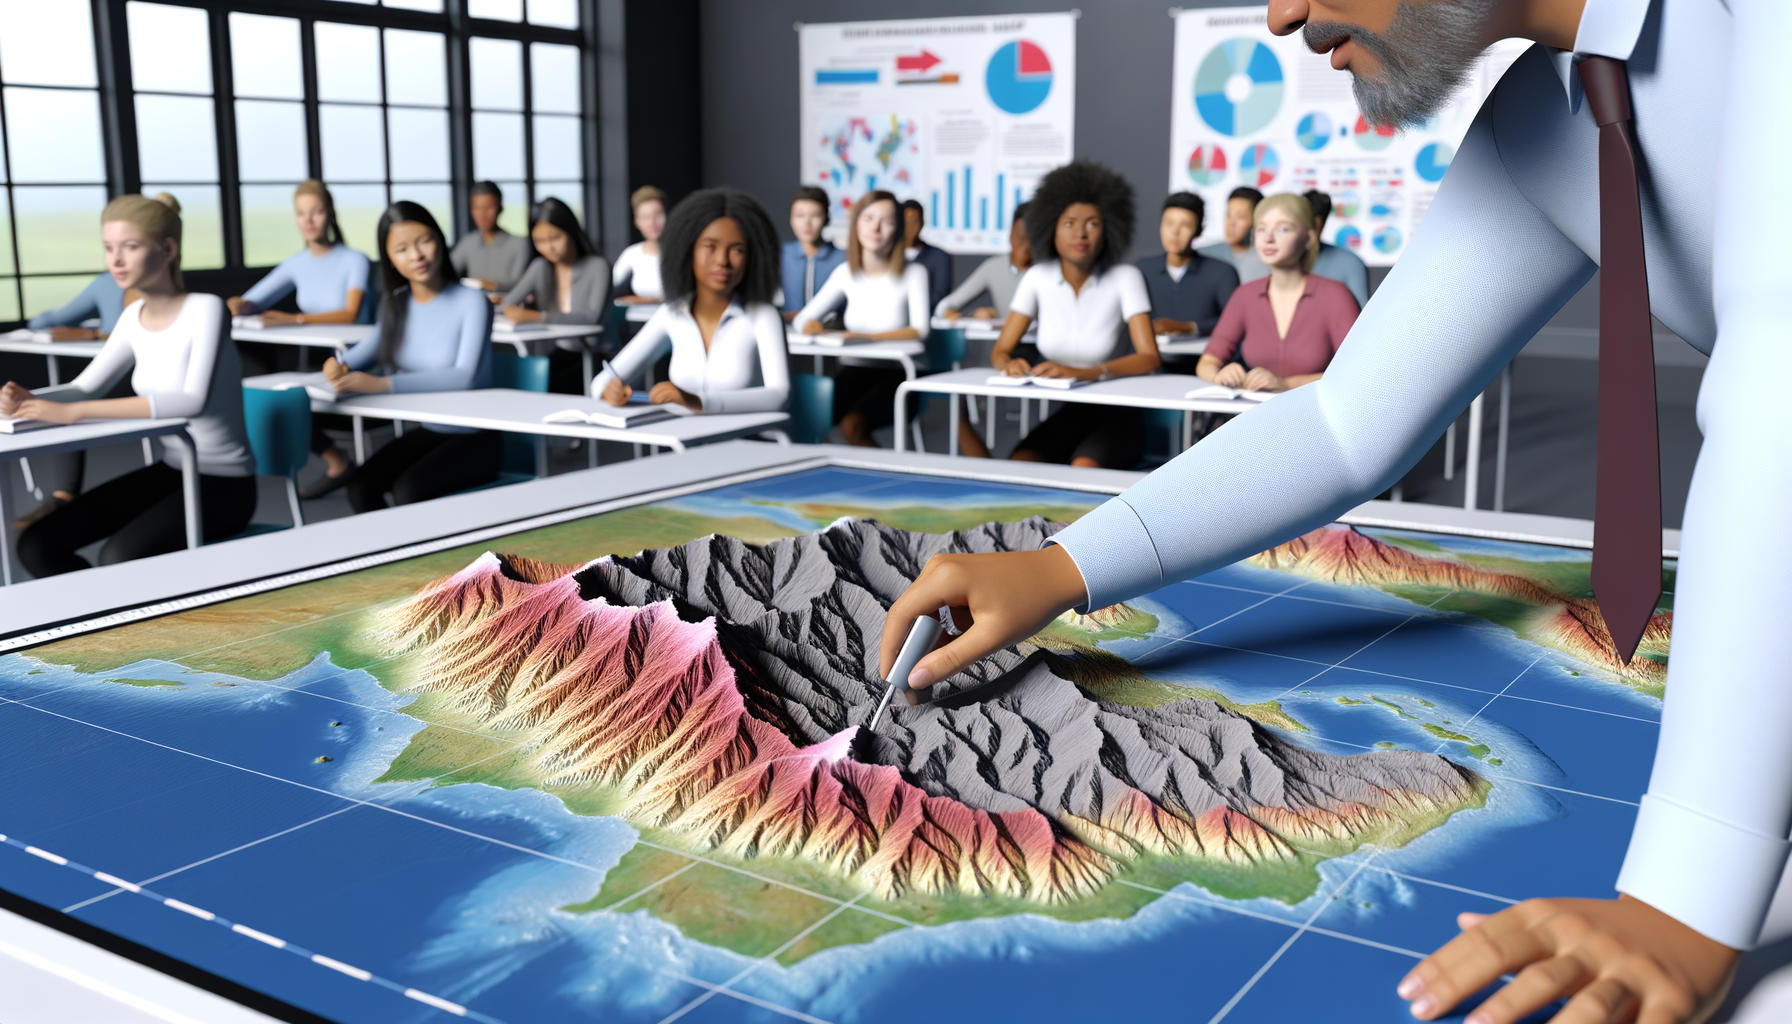
At their core, raised relief maps are three-dimensional representations of the Earth's surface, or a specific region of it. Unlike flat maps that use contour lines, shading, or coloring to *represent* elevation, these maps literally show the hills, valleys, mountains, and plains rising off the surface.
They are typically created by vacuum-forming a plastic sheet over a mold that has been shaped according to topographical data. This process creates a durable, lightweight map where vertical elevation is exaggerated relative to horizontal distance to make the topographical features more pronounced and easily discernible.
This physical dimension allows users to not just see, but also touch and feel the topography of the land. They combine visual information, such as political boundaries, bodies of water, and place names, with tactile information about the shape and elevation of the terrain, offering a multi-sensory learning experience that flat maps cannot replicate.
The Unique Advantages of Raised Relief Maps for Disaster Education
Why specifically choose a raised relief map when teaching about natural disasters? While many tools exist, the unique physical nature of these maps provides several compelling benefits that are particularly relevant to understanding hazard events.
These advantages stem directly from the map's ability to make the invisible visible and the abstract concrete, connecting geographical features to real-world processes in a way that resonates deeply with learners of all ages.
Bringing Topography to Life
The most obvious advantage is how effectively they represent topography. Natural disasters are intrinsically linked to the shape of the land.
Floods follow valleys, landslides occur on steep slopes, storm surge impacts are mitigated or exacerbated by coastal elevation, and volcanic eruptions create dramatic changes in the landscape. A raised relief map allows students to physically see and feel these slopes, depressions, and elevations.
This immediate, tactile understanding of the terrain is far more intuitive than interpreting abstract contour lines on a flat map, making it easier for students to grasp how water flows downhill, how mountains act as barriers or conduits for weather systems, or why certain areas are more prone to landslides.
Enhancing Spatial Understanding
Spatial understanding, the ability to comprehend the relationships between objects and places in space, is fundamental to geography and disaster preparedness. Raised relief maps significantly boost this skill.
By providing a three-dimensional model, they help students visualize not just *where* places are located, but *how* they relate to surrounding landforms. This allows for a deeper understanding of concepts like watersheds, where rain falling on a vast area collects into rivers flowing downhill.
Students can trace potential flood paths, identify areas vulnerable to storm surge based on low elevation, or see how proximity to a fault line or volcanic mountain range translates to increased risk. This comprehensive spatial grasp is essential for understanding hazard maps and planning for safety.
Boosting Engagement and Retention
Hands-on learning is widely recognized as a powerful method for increasing student engagement and improving knowledge retention. Raised relief maps are inherently tactile and interactive.
Students are naturally drawn to touch and explore the contours of the map, making learning a more active and memorable process. This physical interaction helps solidify the abstract concepts being taught, embedding them more deeply than passive listening or viewing.
The novelty and tangibility of the map can also make complex or potentially dry geographical data more interesting and accessible, sparking curiosity and encouraging students to ask questions about the landforms they are exploring and the processes that shaped them.
Applying Raised Relief Maps to Specific Natural Disasters
The real power of raised relief maps in disaster education lies in their ability to illuminate the geographical factors specific to different types of hazards. Let's explore how these maps can be applied to teach about some of the most significant natural disasters our world faces.
Earthquakes and Plate Tectonics
While plate tectonics occurs far beneath the surface, its effects are often dramatically visible in the topography above. Fault lines, where tectonic plates meet and stress builds, are frequently associated with mountain ranges, rift valleys, or areas of significant elevation change.
A raised relief map showing major geological features or simply detailed topography can help students visualize the surface expressions of these underground forces. You can point out mountain chains formed by colliding plates or valleys created by divergent boundaries.
By overlaying or marking the locations of major fault lines (which can often be inferred from sharp topographical changes or are sometimes printed on geological maps) on a raised relief map, students can see the direct correlation between areas of high seismic risk and specific geographical features. Discussion can focus on how the stresses building along these visible or inferred boundaries eventually release as earthquakes.
Activities might involve mapping historical earthquake epicenters on the relief map and discussing why certain regions (like the circum-Pacific "Ring of Fire," which corresponds to intense volcanic and seismic activity along plate boundaries often marked by mountain ranges) experience frequent seismic events due to their underlying tectonic structure and how this structure is reflected in the surface topography.
Volcanoes and Volcanic Activity
Volcanoes are perhaps the most visually dramatic geological features directly related to internal Earth processes, and they are clearly represented on raised relief maps. These maps allow students to see the conical shapes of stratovolcanoes or the broad shields of shield volcanoes, understanding them as mountains built over time by eruptions.
More importantly, raised relief maps help teach about the *behavior* of volcanic hazards in relation to topography. Lava flows, lahars (volcanic mudflows), and pyroclastic flows are all heavily influenced by gravity and the slope of the land.
Using a raised relief map of a volcanic region, students can trace potential paths that lava or mudflows might take, identifying which towns or areas downhill from the volcano are most at risk. The maps can also help explain the formation of volcanic landforms, such as calderas or volcanic island chains, which are often dramatically rendered in relief.
Teaching about the Ring of Fire becomes even more impactful when students can see the chain of volcanic mountains and island arcs physically represented on a globe or regional map in 3D, connecting the visual geography to the underlying geological activity.
Flooding and Waterways
Flooding is one of the most common and widespread natural disasters, and it is inextricably linked to topography and hydrology. Raised relief maps are exceptionally effective for teaching about watersheds, river systems, and flood plains.
Students can physically trace the high points (divides) that define a watershed and follow how water would flow downhill through tributaries to larger rivers and eventually to lakes or the ocean. They can identify flat, low-lying areas adjacent to rivers – the flood plains – and understand why these areas are particularly vulnerable when rivers overflow.
Simulating water flow on a raised relief map (perhaps with a finger or even a carefully controlled amount of water, if the map is suitable and protected) can vividly demonstrate how rainfall collects and moves across the landscape, showing how topography channels water and determines which areas will be inundated.
Discussion can focus on how human modifications like levees or dams interact with natural topography and water flow, and how understanding the watershed is critical for managing flood risk across an entire region.
Hurricanes, Storms, and Coastal Impacts
While hurricanes form over the ocean, their most devastating impacts occur when they make landfall, and these impacts are heavily influenced by coastal geography and inland topography. Raised relief maps of coastal regions are invaluable for understanding storm surge and inland flooding.
Students can see how low-lying coastal areas are directly exposed to rising sea levels pushed ashore by hurricane winds. The slope and shape of the coastline on the map can help explain why some areas experience greater surge than others.
Moving inland, the maps show how topography affects rainfall runoff. Steep slopes can lead to rapid runoff and flash floods, while flat areas might experience more prolonged inundation. Valleys can also channel high winds, increasing their destructive power in specific locations.
Using a map of a hurricane-prone region, educators can track historical hurricane paths, identify vulnerable coastal communities based on elevation, and discuss how inland waterways and topography contribute to the overall risk from a major storm, connecting the large-scale weather event to the local geographical impact.
Tsunamis and Coastal Vulnerability
Tsunamis are colossal waves often triggered by underwater earthquakes or landslides, and their impact is dramatically shaped by coastal topography. While a standard raised relief map doesn't show the ocean floor depth that influences tsunami generation and propagation across the ocean, it is crucial for understanding the *runup* and *inundation* once the wave reaches the shore.
Coastal raised relief maps allow students to see the elevation of coastal land and the presence of features like cliffs, bays, or estuaries. These features significantly influence how a tsunami wave behaves upon arrival – cliffs may cause reflection, while bays and estuaries can funnel and amplify the wave, pushing water further inland.
By examining the coastal topography on the map, students can identify areas that are low-lying and flat, and therefore highly vulnerable to extensive inundation, versus areas with steeper elevations that might offer natural protection or limit the inland extent of flooding.
Connecting the geological event (like an earthquake offshore, which can be located on a global relief map) to the coastal geography on a detailed regional map helps students understand the full sequence of a tsunami disaster and the vital role of land elevation in determining risk.
Practical Strategies for Classroom Integration
Owning a raised relief map is just the first step; effectively using it in lessons is key. Here are some practical strategies for incorporating these powerful tools into your geography, earth science, or disaster preparedness curriculum.
Lesson Planning with Raised Relief Maps
Integrate the map directly into your lesson plans as a central visual and tactile aid. Do not just display it; actively use it.
When discussing a specific disaster event or type, locate the relevant region on the raised relief map. Use the map to introduce the geographical setting before discussing the event itself. This provides essential context.
Design activities that require students to interact with the map. This could involve locating specific places, tracing routes, identifying landforms, or marking data points directly on the map (if using a map designed for marking or using temporary markers).
Engaging Hands-On Activities
Hands-on activities make learning memorable. Here are a few ideas utilizing raised relief maps:
- 1. Trace a Watershed: Provide students with a raised relief map showing a river system. Ask them to identify the highest points surrounding the system and trace the imagined boundary of the watershed. Discuss where rain falling within that boundary would eventually flow.
- 2. Simulate Water Flow (Carefully!): For durable maps, a spray bottle or small cup of water can demonstrate how water moves downhill, pools in depressions, and follows valleys. Discuss how this relates to flooding. Ensure the map can handle moisture or use a protective sheet if necessary.
- 3. Map Historical Events: Provide students with coordinates or locations of significant natural disasters (earthquakes, volcanic eruptions, major floods). Have them locate these points on the raised relief map and discuss how the local topography might have influenced the event or its impact.
- 4. Predict Hazard Impact: Present students with a hypothetical scenario (e.g., "a category 3 hurricane makes landfall here" or "an earthquake occurs at this location"). Using the raised relief map, have them identify which areas might be most vulnerable to storm surge, high winds, or ground shaking based on the topography.
- 5. Model with Clay: Use modeling clay to add features or modify the landscape on specific areas of the map (e.g., building a levee, simulating a landslide). Discuss how these changes would affect the flow of water or other hazards.
These activities encourage active learning and help students make concrete connections between the physical landscape and the processes of natural disasters.
Discussion Prompts and Critical Thinking
Use the map as a springboard for critical thinking and discussion. Ask open-ended questions that require students to analyze the relationship between topography and disaster risk.
Examples include: "Why do you think this city, located near a river on this flat plain, is particularly vulnerable to flooding?" or "How might the elevation of this coastal town affect its exposure to a tsunami?" or "Can you see any landforms on this map that might indicate past volcanic activity or seismic stress?"
Compare different regions on the map. Why is earthquake risk high here (near a visible mountain range/fault line) but low there (in a flat, stable plain)? Encourage students to articulate their reasoning based on the visual and tactile information provided by the map.
Discuss disaster preparedness and mitigation in the context of the geography shown on the map. Where would be the safest place to evacuate during a flood? How might building codes differ in mountainous areas prone to landslides versus flat coastal zones?
Integrating with Other Educational Tools
Raised relief maps are powerful, but they are even more effective when used in conjunction with other resources. Combine them with digital maps, satellite imagery, geological maps showing rock types or fault lines, historical photographs, survivor accounts, and scientific data.
For example, show students a satellite image of a flooded area and then locate that area on the raised relief map to understand *why* the flooding occurred there based on the topography. Overlay historical flood data or earthquake epicenters from a digital source onto the physical map for a multi-layered analysis.
This integrated approach provides a richer, more comprehensive understanding of natural disasters, leveraging the unique strengths of each tool while anchoring the spatial context in the tangible reality of the raised relief map.
Choosing the Right Raised Relief Map
Not all raised relief maps are created equal, and the best choice depends on your specific teaching goals and the age of your students. Consider the following factors when selecting a map for teaching about natural disasters.
Scale and Detail Considerations
Maps come in various scales, from global or continental maps showing major mountain ranges and river systems to highly detailed regional or even local maps focusing on specific states, counties, or metropolitan areas. For teaching about the *global patterns* of earthquakes and volcanoes (like the Ring of Fire or the Mid-Atlantic Ridge), a global or continental map is appropriate.
However, for understanding the *local impact* of disasters – how a specific river affects flood risk in a town, or the vulnerability of a particular coastal community to storm surge – a much more detailed regional or local map is necessary. The level of detail in the elevation rendering is also important; higher detail means more accurate representation of smaller hills and valleys, crucial for understanding localized risks.
Consider the vertical exaggeration as well. While exaggeration makes topography more visible, excessive exaggeration might distort spatial relationships. Choose a map where the exaggeration is clear and appropriate for the features being highlighted.
Geographic Area Focus
Prioritize maps of geographic areas that are most relevant to your students. Start with a map of your local area, state, or country. Discussing natural disaster risks and geographical features that are familiar to students makes the topic immediately relevant and engaging.
Once students understand the principles using their local context, you can expand to maps of areas known for specific types of disasters, such as California or Japan for earthquakes, Hawaii or Iceland for volcanoes, Bangladesh or the Netherlands for flooding, or the Gulf Coast of the United States for hurricanes.
Having a variety of maps focusing on different disaster-prone regions allows for comparative studies, helping students understand how geography influences the types and severity of disasters experienced around the world.
Map Features and Data Overlays
Look for maps that include relevant geographical information in addition to topography. Political boundaries, major cities, rivers, lakes, and coastlines provide essential context. Some maps may also include geological data, such as major fault lines or volcanic zones, which are directly relevant to disaster education.
Consider maps designed for educational use, which might have features like clear labeling, scale bars, and legends. Some maps are made from materials that allow for temporary marking with dry-erase markers, which can be incredibly useful for activities like marking historical disaster locations or tracing paths.
Ensure the map's features are clear and easy for students to interpret alongside the three-dimensional relief. The combination of visual data and tactile topography enhances the learning experience.
Beyond the Classroom: Raised Relief Maps for Community and Home
The value of raised relief maps extends beyond the traditional classroom setting. They can be powerful tools for community education and personal preparedness, fostering informed citizenship and safety awareness.
Community Preparedness and Awareness
Government agencies, emergency management offices, and community centers can use large-scale raised relief maps of their local area to educate the public about potential natural hazards. Seeing the local topography in 3D can make flood plain maps, evacuation routes, and hazard zones much more understandable to the average citizen.
Workshops or public forums using these maps can facilitate discussions about local risks – where are the low-lying areas prone to flooding? Where are the steep slopes where landslides might occur? Where are the major river systems or potential inundation zones? Visualizing these risks on a tangible map can significantly improve public awareness and encourage preparedness actions.
They can also be used in planning meetings, helping officials and residents visualize the potential impact of development projects or mitigation efforts in relation to the existing landscape.
Personal Understanding and Home Use
For families, a raised relief map of their state or region can be a fantastic educational tool at home. It encourages discussions about geography, travel routes, and, importantly, the natural hazards present in their area.
Children can learn about the topography around their home, understand why local rivers might flood, or recognize the mountains where wildfires are a risk. This can foster a sense of place and an informed understanding of the environment they live in.
Knowing the local geography, visually represented in 3D, can contribute to a family's preparedness plan by helping them understand their own vulnerability and potential evacuation routes based on the terrain. It transforms an abstract map into a personal connection with the landscape and its potential risks.
Conclusion: Empowering Understanding Through Topography
Teaching about natural disasters is more than just presenting facts about earthquakes, volcanoes, floods, and storms. It is about fostering a deep understanding of the Earth's dynamic systems and how human communities interact with them. It is about building spatial literacy and empowering individuals with the knowledge to understand risk and promote safety.
Raised relief maps offer a uniquely effective pathway to this understanding. Their ability to make topography tangible transforms abstract geographical concepts into concrete realities, allowing students and others to literally get their hands on the landscape.
By integrating these maps into educational curricula and community programs, educators and leaders can provide learners with an intuitive grasp of how the shape of the land directly influences natural hazards. This leads to enhanced engagement, improved retention, and a more profound spatial understanding.
In a world where understanding natural disasters is increasingly critical for resilience and safety, embracing tools like raised relief maps is not just beneficial – it is essential. They bring the powerful forces shaping our planet down to a human scale, fostering informed curiosity and preparing the next generation to navigate a complex and ever-changing world with greater confidence and knowledge. Invest in topography, invest in understanding, invest in safety.