


Exploring Environmental Landscapes: How Raised Relief Maps Enhance Studies
The surface of our planet is a complex tapestry of mountains, valleys, rivers, and plains, constantly shaped by natural forces and human activity. Understanding this intricate topography is absolutely fundamental to effective environmental studies, conservation efforts, and resource management. Traditional 2D maps provide essential data, yet they can sometimes fall short in conveying the intuitive three-dimensional reality of the land, which is crucial for grasping spatial relationships and physical processes.Environmental scientists, geographers, educators, and policymakers face the challenge of not only collecting vast amounts of data but also interpreting and communicating the significance of landscape features in a way that resonates deeply. How does water flow across a watershed? Where are areas susceptible to erosion or flooding? How does elevation influence ecosystems and human settlement patterns? These questions are central to understanding environmental systems. Fortunately, there is a powerful tool that bridges the gap between flat data and tangible understanding: the raised relief map.
Raised relief maps are not just decorative objects; they are dynamic, tactile representations of the Earth's surface that provide unparalleled insights into topography and its influence on environmental processes. By offering a physical model of the landscape, these maps make complex concepts like elevation change, slope, and drainage patterns immediately intuitive and understandable. This post will delve into the specific ways raised relief maps serve as invaluable aids in a wide range of environmental studies, enhancing analysis, education, and communication, and offering a tangible solution to the challenge of visualizing our planet's dynamic surface.
What Exactly Are Raised Relief Maps?
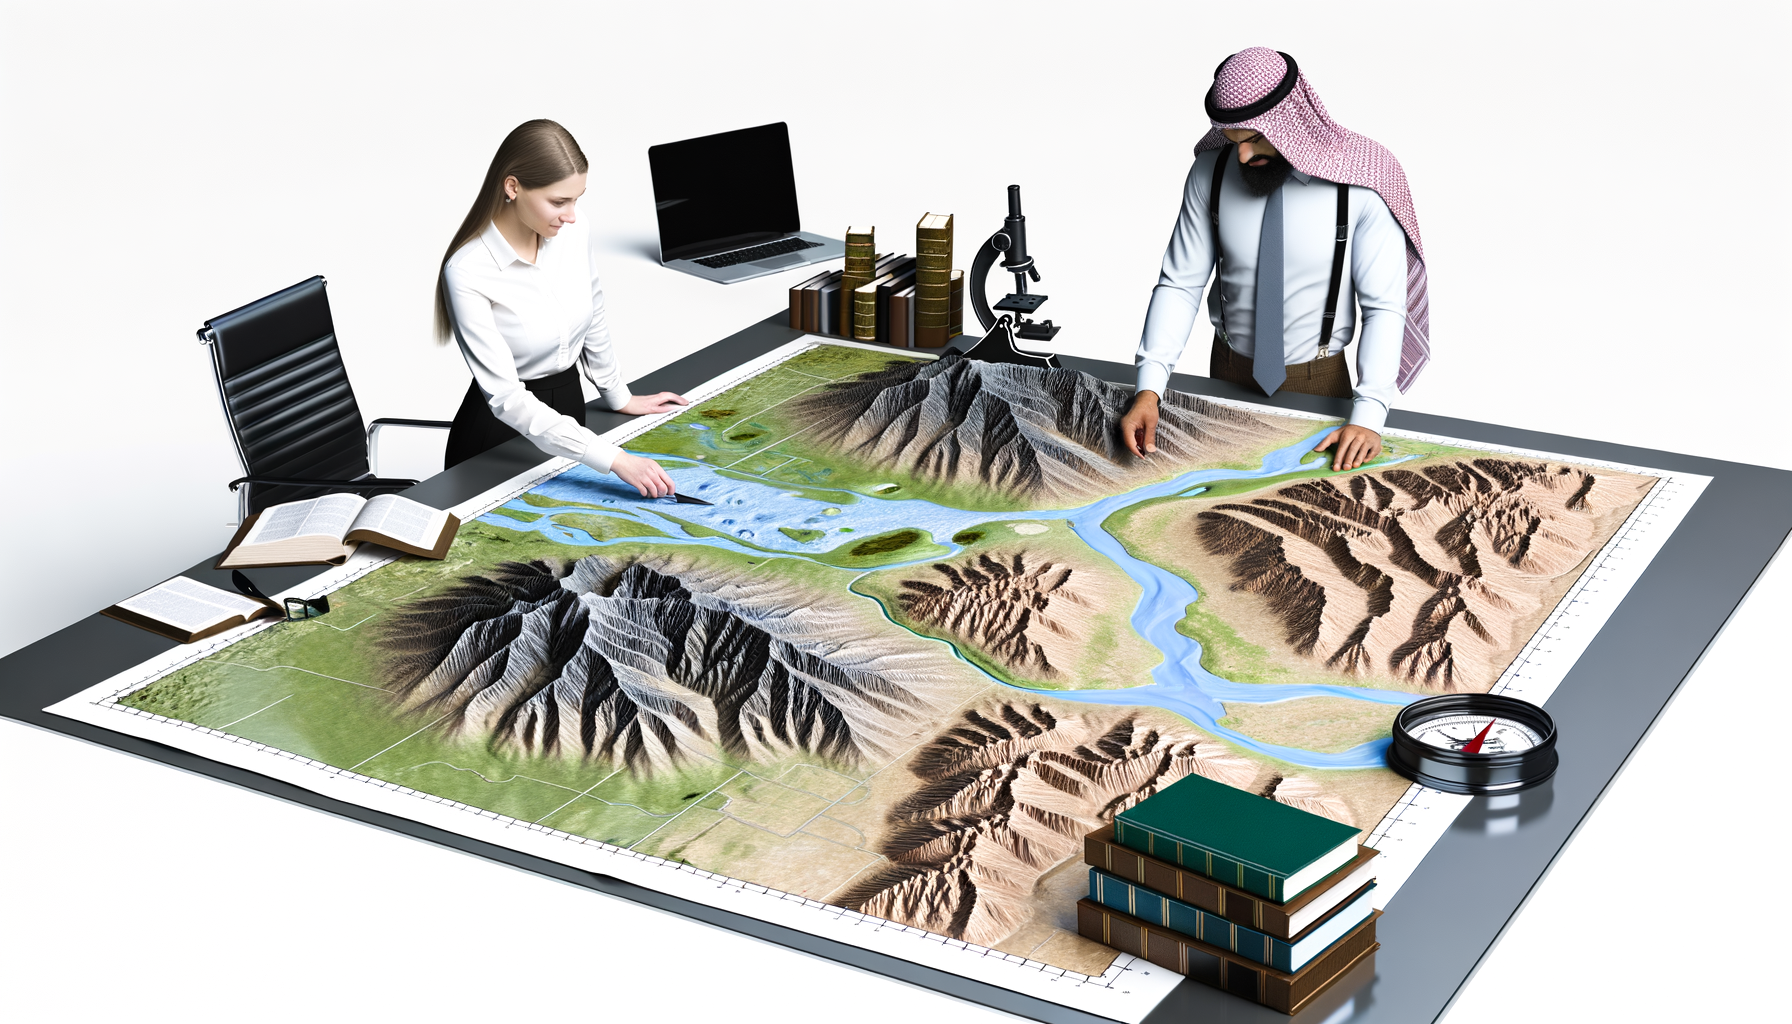
At its core, a raised relief map is a three-dimensional model of a land surface, typically rendered on a flat base map. Unlike standard contour maps or shaded relief maps which use lines or shading to depict elevation, raised relief maps actually lift the surface material to physically represent the variations in terrain height. This creates a tactile and visual experience that closely mimics the real-world topography.These maps are usually created by forming or molding a material, often plastic or a composite, over a mold derived from topographic data such as contour lines or digital elevation models (DEMs). The underlying base map provides geographical context, including features like political boundaries, roads, rivers, and place names, overlayed onto the molded surface. The result is a map you can not only see but also touch, allowing you to literally feel the elevation changes.
A critical aspect of many raised relief maps is vertical exaggeration. Since the horizontal scale of a map is usually much larger than the vertical variation in terrain within a given area (e.g., mountains might be only a few kilometers high over hundreds of kilometers horizontally), the vertical dimension is often amplified. This exaggeration makes subtle terrain features, like small hills or gentle slopes, much more noticeable and interpretable on the map than they would be if scaled true-to-life. Understanding this vertical exaggeration is key to correctly interpreting the steepness represented on the map.
The creation of raised relief maps has evolved significantly over time, from early handcrafted models using materials like plaster or clay to modern methods utilizing vacuum forming, 3D printing, or CNC milling based on precise digital data. This evolution has allowed for greater accuracy, detail, and the ability to create maps of vast and diverse areas. Whether depicting a small local park or an entire continent, raised relief maps provide a unique perspective on the physical world.
Why Tangible Understanding Matters in Environmental Studies
Environmental studies are inherently spatial; they involve understanding processes that occur across landscapes. While digital tools are powerful for analysis, there is a fundamental cognitive advantage to interacting with a physical representation of the Earth's surface. Our brains are wired to understand 3D space through touch and sight simultaneously.A flat map, no matter how detailed, requires a mental translation to fully grasp the ups and downs of the terrain. Contour lines, for instance, are abstract symbols that one must learn to interpret to visualize slope and elevation change. Shaded relief maps offer a visual representation of shadows cast by terrain, which aids visualization, but it is still an optical illusion based on light direction.
A raised relief map eliminates this mental translation step. When you run your hand over a raised map, you directly experience the changes in elevation and the steepness of slopes. This tactile engagement provides an immediate, intuitive understanding of the landscape's form. This direct physical interaction enhances spatial reasoning skills, which are crucial for environmental analysis and problem-solving.
Furthermore, the tangible nature of raised maps makes them incredibly effective for communication and collaboration. Pointing to a physical hill or valley on a map that everyone can see and touch fosters a shared understanding of the terrain being discussed. This is particularly valuable when explaining complex environmental issues, such as flood risk or habitat fragmentation, to diverse groups, including students, stakeholders, or the general public who may not have a background in reading traditional topographic maps.
This tangible understanding is not just about ease of use; it can also lead to deeper insights. By physically observing the relationships between different landscape features – how valleys connect, where plateaus sit, how mountains form barriers – researchers and students can develop a more holistic perception of the environmental system they are studying. It brings the landscape to life in a way that flat representations, or even screen-based 3D models (which lack the tactile element), often cannot fully replicate.
Key Ways Raised Relief Maps Aid Environmental Analysis
Raised relief maps are far more than just educational novelties; they are functional tools that provide direct, actionable insights across various sub-disciplines of environmental studies. Their ability to make topography immediately apparent facilitates numerous analytical tasks that are critical for understanding environmental processes and managing natural resources effectively. Let's explore some of the primary ways these maps are put to use in environmental analysis.Understanding Topography and Landforms
The most immediate benefit of a raised relief map is its clear depiction of topography – the arrangement of the natural and artificial physical features of an area. You can instantly see the shape of mountains, the depth of valleys, the extent of plains, and the presence of plateaus or ridges. This allows for rapid identification and classification of major landforms within a region.Understanding these landforms is foundational to numerous environmental studies. Geologists use them to infer underlying geological structures and processes that shaped the terrain over millennia. Ecologists observe how different landforms create varied habitats and microclimates, influencing species distribution and ecosystem structure. Soil scientists understand how topography affects soil formation, erosion, and drainage, which in turn impacts soil type and fertility.
For instance, identifying steep slopes on a raised map can highlight areas prone to landslides or rapid erosion, which is critical for hazard assessment and land-use planning. Conversely, recognizing flat, low-lying areas helps identify potential floodplains or wetlands. The physical presence of the terrain allows for a more intuitive grasp of how different landforms interact with each other and how they might respond to natural events or human interventions. It provides a tangible mental model upon which further data and analysis can be layered.
Visualizing Drainage Basins and Water Flow
Perhaps one of the most powerful applications of raised relief maps in environmental studies is in visualizing hydrology and drainage patterns. Water flows downhill, and a raised map makes the concept of "downhill" unequivocally clear. By examining the map, one can easily identify the highest points, the ridges that form watershed divides, and the valleys where water collects and flows.Tracing imaginary lines on the map to follow the path of water reveals drainage networks and helps delineate drainage basins (or watersheds). A drainage basin is the area of land where all surface water converges to a single point at a lower elevation, such as a river confluence or a lake outlet. Understanding the boundaries and characteristics of drainage basins is fundamental for managing water resources, studying river systems, predicting flood risks, and tracing the source and movement of pollution.
A raised map clearly shows how tributaries merge, how stream gradients change, and where lakes or reservoirs might naturally form within the terrain. This physical representation significantly aids in explaining and understanding complex hydrological concepts. For educators, demonstrating watershed dynamics on a raised map is far more impactful than drawing lines on a flat surface; students can literally see and feel the landscape that dictates the water's path, making the concept concrete and memorable.
Analyzing Geological Structures and Processes
Topography is often a direct reflection of underlying geological structures and processes. Fault lines can manifest as scarps or linear valleys. Folded rock layers can create parallel ridges and valleys (as seen in the Appalachian Mountains). Erosion and deposition shaped by geological forces create distinctive landforms like mesas, buttes, or deltas.While geological maps show the distribution of rock types and structures, a raised relief map provides the essential context of the *shape* of the land these structures create. Geologists can use raised maps to visualize how exposed rock layers relate to the surface terrain, helping them infer subsurface conditions. For example, identifying a prominent ridge line corresponding to a resistant rock layer shown on a geological overlay map helps confirm geological interpretations and understand the differential erosion that shaped the landscape.
Raised maps are also invaluable for visualizing the impact of active geological processes like volcanism or glaciation. The form of a stratovolcano or the characteristic U-shaped valleys carved by glaciers are immediately apparent on a raised relief map, providing a tangible representation of these powerful forces. Studying areas affected by seismic activity, a raised map can help visualize how fault lines interact with topography and identify areas potentially susceptible to ground deformation or landslides triggered by earthquakes.
Studying Vegetation Patterns and Habitats
Topography plays a significant role in determining microclimates, soil conditions, and drainage, all of which influence vegetation patterns and the distribution of ecological habitats. Elevation changes lead to variations in temperature and precipitation. Slope aspect (the direction a slope faces) affects sunlight exposure, influencing temperature and moisture levels, and thus the types of plants that can thrive. Steeper slopes may have thinner soils due to erosion, while flatter areas can accumulate deeper soil profiles.By using a raised relief map alongside vegetation or habitat maps, environmental scientists can gain insights into these spatial relationships. They can see how different forest types correlate with elevation zones or how wetlands are located in low-lying areas near drainage channels. Visualizing the physical barriers created by mountains or valleys helps understand potential corridors or obstacles for wildlife movement and gene flow, which is crucial for conservation planning and designing protected area networks.
Understanding how topography fragments or connects habitats is essential for assessing ecological resilience and planning for species conservation. A raised map makes these landscape connections and disconnections physically evident. It aids in discussions about landscape connectivity and the potential impacts of climate change, where shifts in temperature or precipitation patterns could cause habitat zones to migrate upslope or downslope, making physical barriers even more critical factors.
Assessing Human Impact on the Landscape
Human activities profoundly alter the natural landscape, and raised relief maps can be powerful tools for visualizing and assessing this impact. Infrastructure projects like roads, railroads, dams, and buildings are often built in response to, or in defiance of, the existing topography. Visualizing these human features on a raised map allows for a clearer understanding of their interaction with the natural terrain.For example, seeing how a road cuts through a mountain pass or how a dam creates a reservoir in a valley bottom provides a tangible sense of the scale and location of human modifications. Raised maps can help visualize the extent of urbanization across varied terrain, showing how cities expand into surrounding hills or valleys. They can also help illustrate the physical footprint of resource extraction, such as mining operations carved into mountainsides or agricultural terraces built on slopes.
This visualization is critical for environmental impact assessments and land-use planning. By seeing the terrain in 3D, planners can better anticipate potential issues like increased runoff and erosion from construction on slopes or the visual impact of development on scenic landscapes. Raised maps facilitate discussions about sustainable development practices, helping to identify areas where development might be most environmentally sensitive or where mitigation measures are particularly necessary due to the terrain. They provide a common ground for discussing how human activities are interwoven with the physical environment.
Modeling and Visualizing Environmental Change
While a single raised map represents a static snapshot in time, they can be used effectively to model and visualize the potential impacts of environmental change, particularly those related to elevation and water. For example, raised maps of coastal areas can be used to demonstrate the potential effects of sea-level rise. By marking or visualizing different sea level elevations on the physical model, one can clearly see which low-lying areas would be inundated, which infrastructure would be affected, and how coastlines would change.Similarly, for areas with glaciers or snowpack, raised maps depicting past and present conditions (if historical topographic data allows for creating comparable maps) can vividly illustrate the extent of retreat or loss. They can also be used to show how changes in precipitation patterns might affect lake levels or river flows within a drainage basin by referencing the terrain.
These visualizations are incredibly powerful for communicating the tangible consequences of climate change and other long-term environmental shifts to a wide audience. Seeing a physical model helps make the abstract concepts of sea-level rise or glacial melt more real and understandable, fostering greater awareness and potentially encouraging action. Raised maps serve as compelling visual aids in presentations and public outreach efforts related to environmental change.
Beyond Visualization: Practical Benefits
The utility of raised relief maps in environmental studies extends beyond simply making terrain visible. They offer several practical benefits that enhance research, education, and collaborative efforts. These advantages stem from their tangible, shareable, and intuitively understandable nature.Enhancing Communication and Collaboration
Environmental challenges often require collaboration among professionals from different disciplines, as well as communication with policymakers, stakeholders, and the general public. Explaining complex spatial relationships and terrain-dependent issues using only abstract data or jargon-filled reports can be difficult. Raised relief maps act as universal translators.Placing a raised map on a table immediately provides a common reference point for discussion. Everyone involved can see the same features, feel the same slopes, and point to specific locations. This shared physical model facilitates clear communication, helps avoid misunderstandings, and allows for more productive discussions about environmental problems and potential solutions. It's an excellent tool for group planning sessions, public consultations, and educational workshops, breaking down barriers posed by differing technical backgrounds.
Integrating Different Data Layers
While a raised map primarily represents topography, it serves as an excellent base onto which other types of environmental data can be conceptually, or sometimes even physically, integrated. Imagine discussing soil types, forest cover, population density, or pollution sources while pointing to their corresponding locations on a tangible terrain model.Researchers often use digital tools like GIS to overlay multiple data layers for analysis. However, when presenting findings or collaborating, referencing these layers on a physical raised map can make the relationships between, say, a particular soil type, the steepness of the slope, and land-use patterns much clearer. One can physically show how agriculture might be concentrated on gentler slopes with deeper soils, while forests cover steeper, rockier terrain, and how a pollution source uphill affects a community located downstream in a valley. The map provides the essential spatial framework for understanding these interdependencies.
Powerful Educational Tools
For students learning about geography, geology, hydrology, and ecology, raised relief maps are unparalleled educational aids. They make abstract concepts concrete and engaging. Students can physically trace river paths, identify mountain ranges, understand contour lines by feeling the elevation changes they represent, and visualize the scale of landforms. This hands-on interaction promotes a deeper and more intuitive understanding of spatial concepts and Earth systems.Educators can use raised maps for interactive lessons, exercises in map reading, watershed delineation activities, and demonstrating the principles of erosion and deposition. They cater to different learning styles, appealing particularly to kinesthetic learners who benefit from touch and movement. A classroom with a good collection of raised relief maps covering different areas and scales provides students with a tactile atlas of the world's diverse landscapes, sparking curiosity and fostering a lifelong appreciation for geography and environmental science.
Comparing Raised Relief Maps to Other Geospatial Tools
Raised relief maps are not a replacement for other geospatial tools, but rather a valuable complement. Understanding their strengths and weaknesses relative to traditional 2D maps and modern digital tools helps maximize their utility in environmental studies. Each tool offers unique advantages.vs. 2D Topographic Maps
Traditional 2D topographic maps, using contour lines, spot elevations, and shading, are the standard tools for detailed terrain analysis. They can represent incredibly intricate variations in elevation and often contain a wealth of additional information like trails, buildings, and boundaries that are difficult or impossible to show on a physical raised map. For precise measurements of distance, bearing, or subtle elevation changes (using contour interpolation), 2D maps are essential and more practical in the field.However, as discussed, interpreting contour lines requires training and effort to visualize the 3D landscape. While shaded relief helps, it's still a 2D representation. Raised relief maps excel precisely where 2D maps require mental translation: providing an immediate, intuitive, tangible sense of the terrain's form and relative elevation. For conveying the overall lay of the land, the scale of landforms, and major spatial relationships (like the structure of a mountain range or the shape of a large watershed), the raised map is often superior, particularly for communication and initial understanding.
vs. Digital Elevation Models (DEMs) and GIS
Digital Elevation Models (DEMs) and Geographical Information Systems (GIS) are cornerstones of modern environmental analysis. DEMs are digital grids of elevation data, forming the basis for powerful computer-based analysis such as calculating slopes, aspects, viewsheds, and modeling hydrological processes like water flow accumulation and flood inundation. GIS software allows for complex spatial analysis, overlaying numerous environmental datasets, running simulations, and creating sophisticated digital maps and 3D visualizations.Digital tools offer unparalleled analytical power, precision, and the ability to handle vast amounts of data dynamically. They are essential for quantitative analysis, large-scale modeling, and generating custom maps. However, they are screen-based and abstract. While GIS can render 3D terrain models on a screen, interacting with them lacks the tactile element of a raised map. Furthermore, explaining complex GIS analysis or the implications of a DEM to someone unfamiliar with the software or data can be challenging.
Raised relief maps serve as a bridge between abstract digital data and tangible reality. They are often created *from* DEM data, translating complex digital information into a physical form. They can be used in conjunction with GIS – analyses performed in GIS can be interpreted or explained using the physical reference of the raised map. They excel in intuitive understanding and communication, areas where digital tools, despite their analytical power, can sometimes fall short in engaging non-experts or fostering a holistic, tactile appreciation of the landscape.
Real-World Applications and Case Studies
Raised relief maps are actively used across various sectors involved in environmental studies and land management. While specific detailed case studies might be tied to proprietary projects, we can broadly identify areas where their unique benefits are leveraged.In **conservation planning**, raised maps help conservationists visualize habitat connectivity, identify critical areas for protection based on topography and water resources, and communicate proposed reserve boundaries or wildlife corridors to landowners and communities. Seeing the terrain helps understand why certain areas are ecological hotspots or challenging for wildlife movement.
For **disaster management**, particularly concerning floods and landslides, raised maps are invaluable. Emergency planners use them to visualize areas most at risk based on slope and proximity to waterways, plan evacuation routes, and coordinate response efforts by providing a clear, shared overview of the affected terrain for first responders.
In **urban and regional planning**, raised maps help planners understand how proposed development interacts with the natural landscape. They aid in siting decisions for infrastructure, assessing visual impacts, managing stormwater runoff by understanding drainage, and planning for sustainable growth that respects terrain limitations. They are excellent tools for public consultations on development projects.
**Resource management**, including forestry, agriculture, and water management, relies heavily on understanding topography. Foresters use raised maps to plan logging operations that minimize erosion on slopes. Agriculturalists assess suitable areas for different crops or irrigation methods based on terrain and water availability. Water managers use them to explain reservoir capacities, dam locations, and water distribution networks within a watershed context.
These examples illustrate that wherever understanding the physical shape of the Earth is critical to studying or managing its environment, raised relief maps offer a uniquely accessible and insightful perspective, serving as practical tools for analysis, planning, and engagement.
How to Effectively Utilize Raised Relief Maps
To get the most out of raised relief maps in environmental studies, consider the following tips:First, understand the map's scale and vertical exaggeration. The horizontal scale tells you the relationship between distance on the map and distance on the ground (e.g., 1:50,000). The vertical exaggeration indicates how many times steeper the terrain appears on the map than it is in reality (e.g., 5x exaggeration). Being aware of these factors is crucial for accurate interpretation of size, distance, and relative steepness.
Second, use the raised map in conjunction with other data. Do not rely solely on the relief map. Use it as a spatial framework to overlay your understanding from 2D maps, aerial imagery, geological maps, soil maps, and digital data from GIS. Mentally or even physically marking key features from other maps onto the raised map can enhance comprehension.
Third, engage with the map tactilely. Run your hands over the terrain, feel the slopes, trace the ridgelines and valleys. This physical interaction deepens the intuitive understanding that the map is designed to provide. Encourage others you are working or studying with to do the same.
Fourth, use it as a communication tool. Place the map centrally during discussions. Point to areas of interest. Ask questions that relate to the terrain visible and tangible on the map. This ensures everyone is literally on the same page (or map) when discussing spatial issues.
Finally, consider the map's purpose. Is it for broad educational purposes, detailed local analysis, or regional overview? Choose a map with an appropriate scale and level of detail for your specific environmental study or application. Large-scale maps show smaller areas with more detail, while small-scale maps show larger areas with less detail but are useful for understanding regional context.
The Future Landscape of Relief Maps
While digital technologies continue to advance rapidly, the fundamental human need to interact with physical objects for intuitive understanding ensures a place for raised relief maps. The future likely involves even closer integration between the physical and digital worlds.Imagine raised relief maps enhanced with augmented reality (AR), where holding a tablet or phone over the physical map overlays real-time data – current weather patterns, pollution levels, land ownership boundaries, or interactive models of flood inundation. This fusion could combine the tangible benefits of the physical map with the dynamic power of digital information.
Advances in 3D printing and fabrication techniques may also make custom raised relief maps more accessible and affordable, allowing researchers and educators to create highly detailed, specific-purpose models of areas of particular interest, potentially incorporating not just terrain but also exaggerated features like geological layers or subsurface structures relevant to environmental studies.
Furthermore, the recognition of the importance of tangible learning and accessible communication methods will likely keep raised relief maps relevant in educational settings and public outreach for environmental causes. As environmental data becomes ever more complex and abundant, tools that simplify its spatial understanding and facilitate clear communication will remain essential. The enduring value of touching and seeing the shape of the land ensures that raised relief maps will continue to play a significant role in how we study, understand, and interact with our environment.
Conclusion
Environmental studies are complex and multifaceted, requiring a deep understanding of the intricate relationships between physical landscapes and ecological processes. While digital tools provide unparalleled analytical power, the ability to visualize and interact with the Earth's surface in a tangible way remains critically important for intuitive understanding, effective communication, and engaging education. Raised relief maps offer this unique advantage, translating abstract geographic data into a physical model that resonates with our innate spatial cognition.From deciphering complex drainage patterns and analyzing geological formations to visualizing the impact of human activity and communicating the realities of environmental change, raised relief maps serve as invaluable aids. They enhance our ability to understand topography, connect landforms to environmental processes, facilitate collaboration among diverse groups, and provide powerful, hands-on learning experiences. They are not merely representations; they are tools that actively shape our understanding of the world around us.
In a field increasingly dominated by digital data and screen-based analysis, the raised relief map stands as a testament to the enduring power of tangible models. Its ability to make the invisible visible and the abstract concrete ensures its continued relevance and importance in classrooms, research labs, planning offices, and conservation organizations worldwide. Embracing the use of raised relief maps can unlock deeper insights, improve communication, and ultimately foster a more profound and actionable understanding of the environmental landscapes we seek to study and protect.